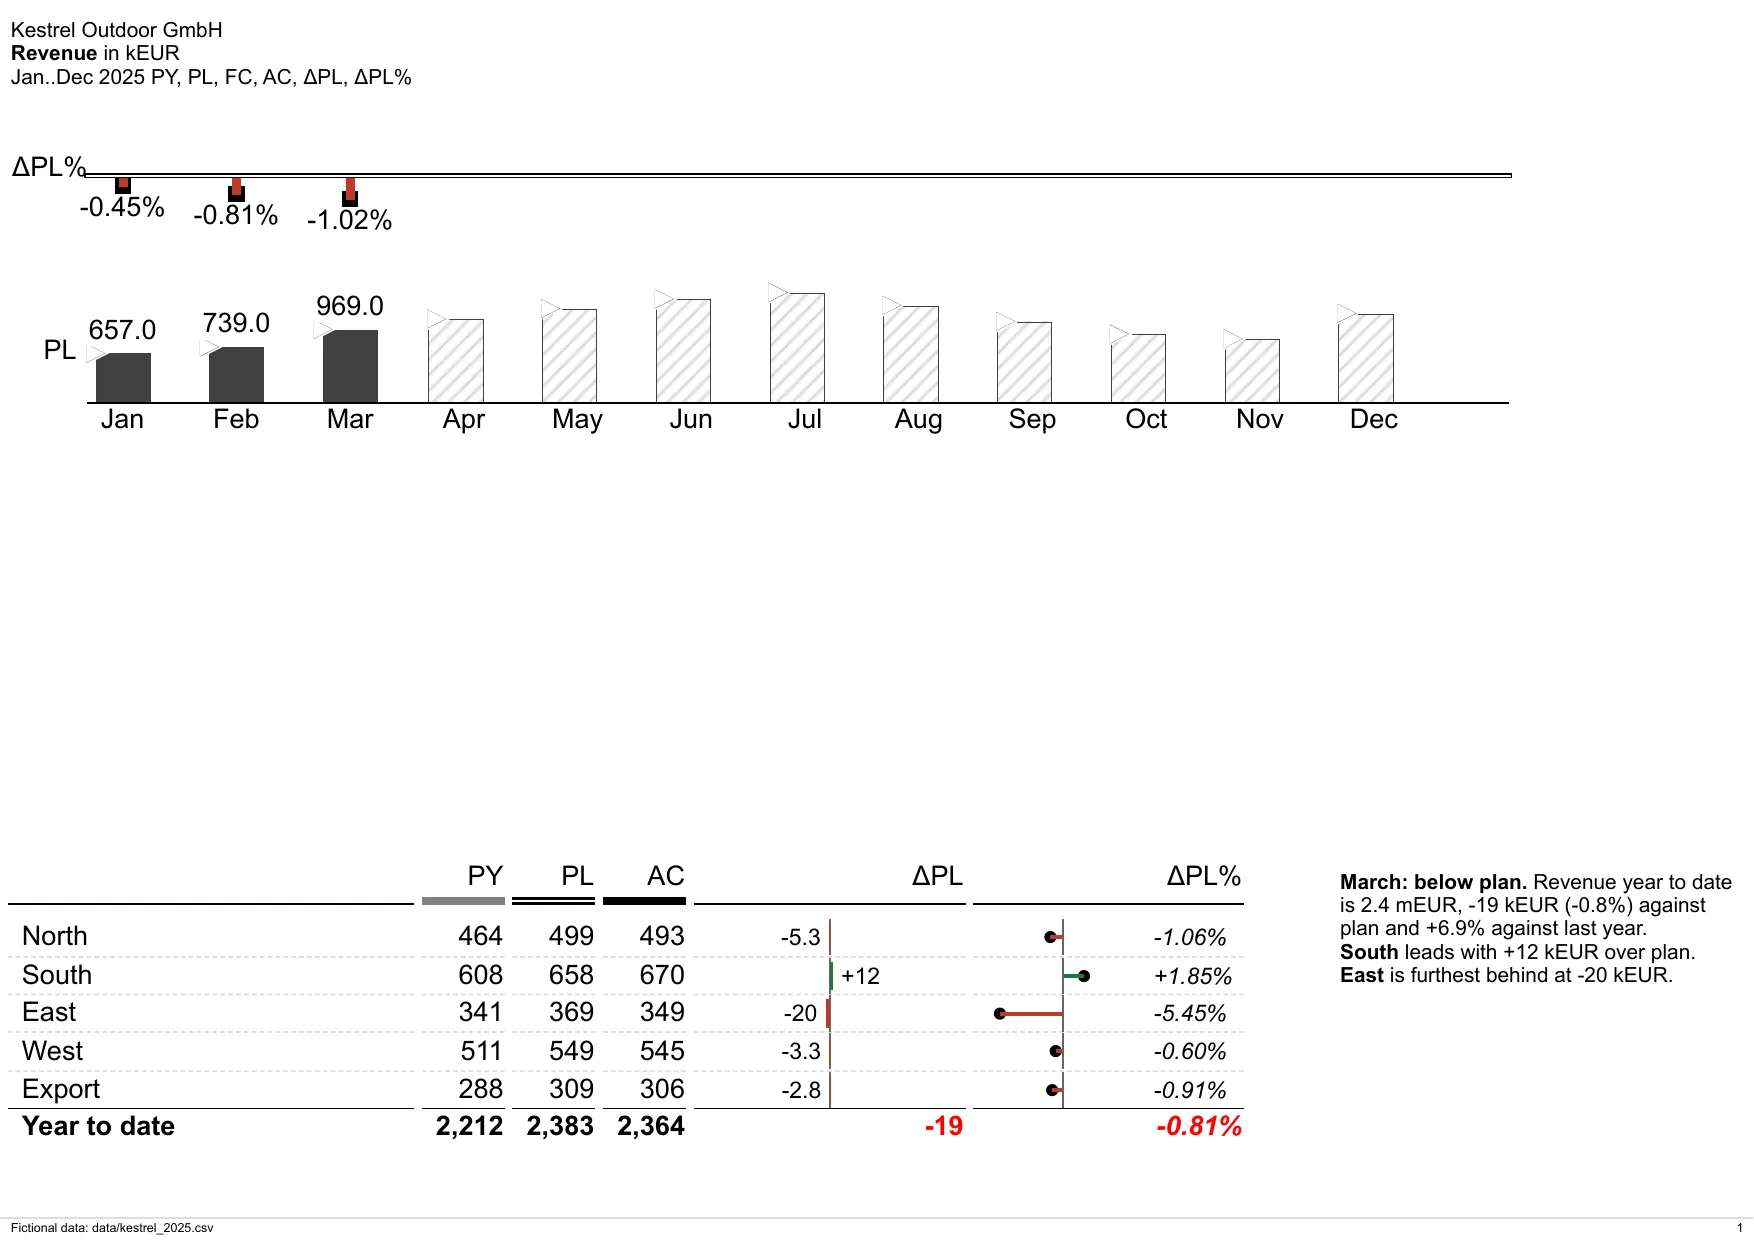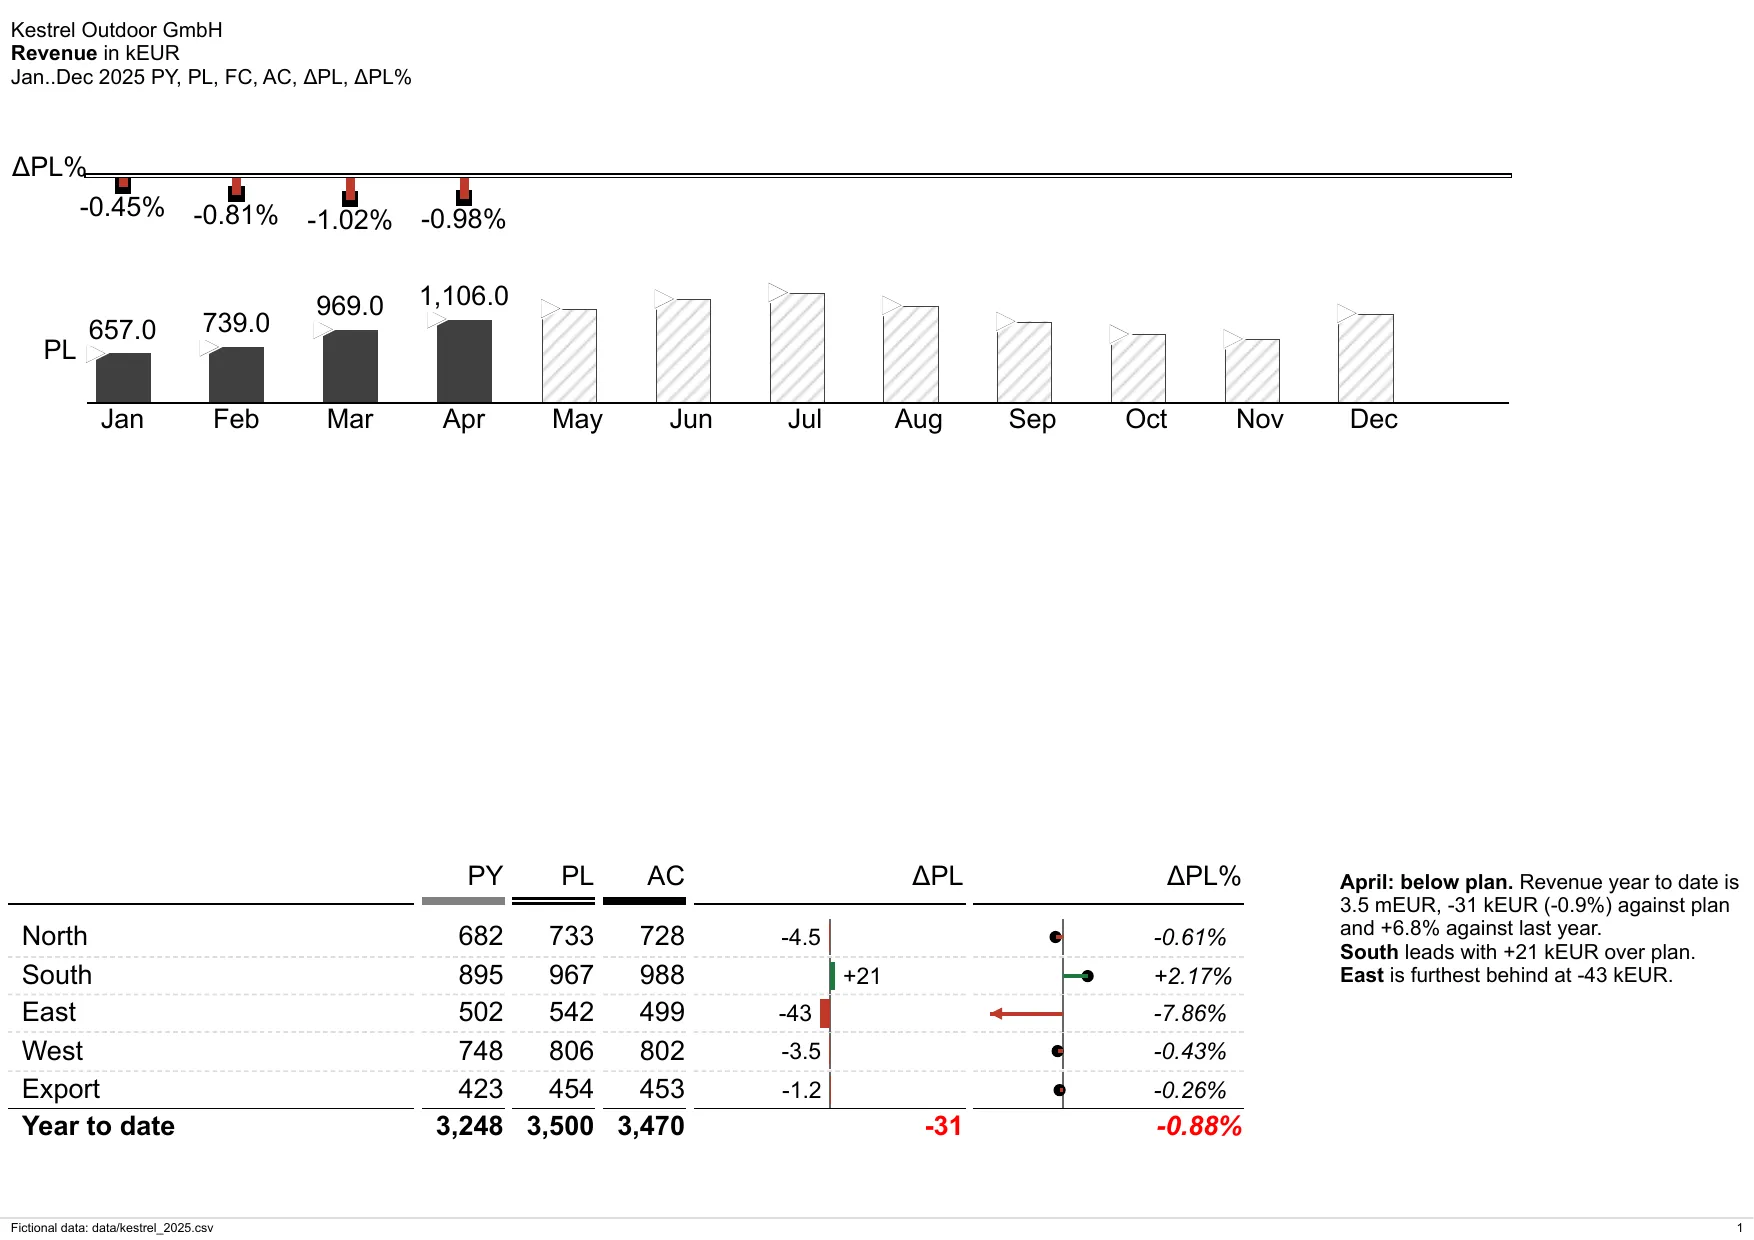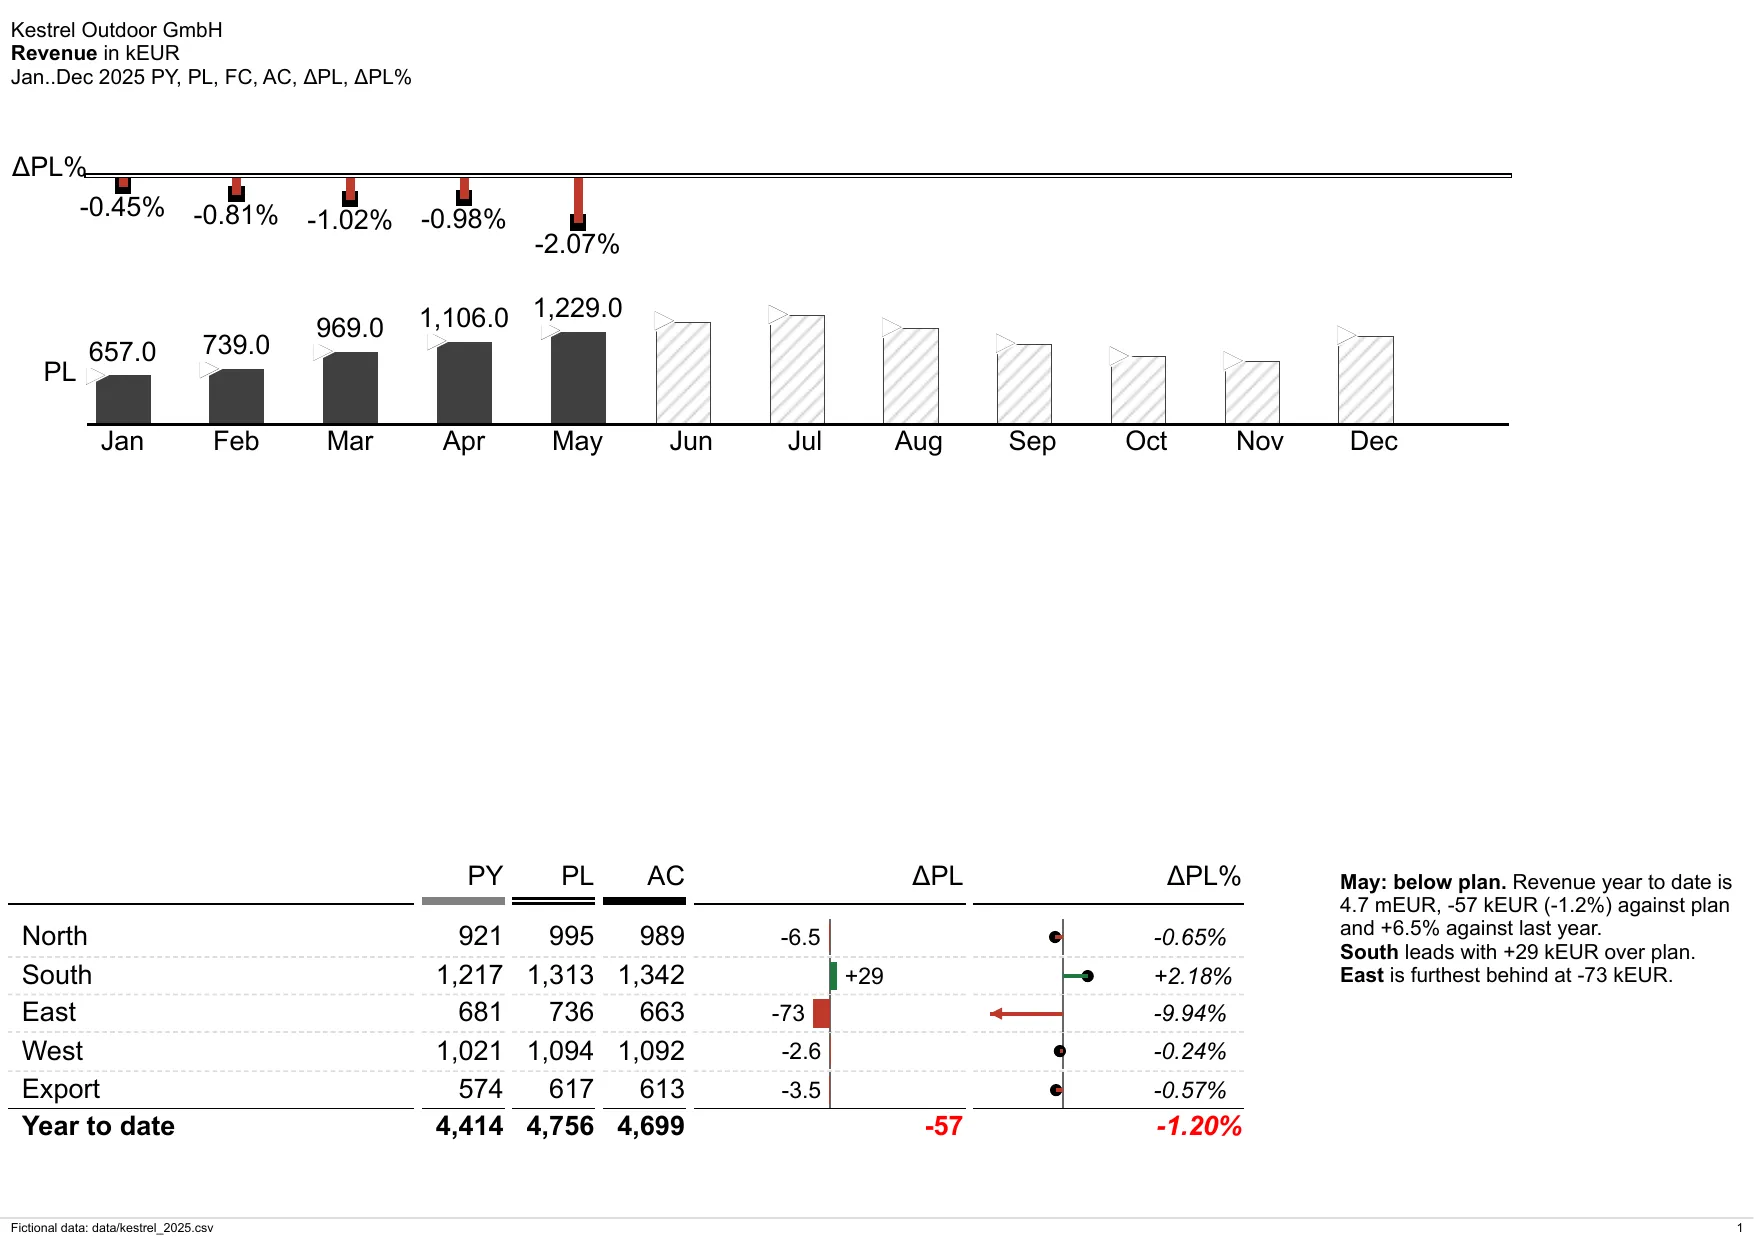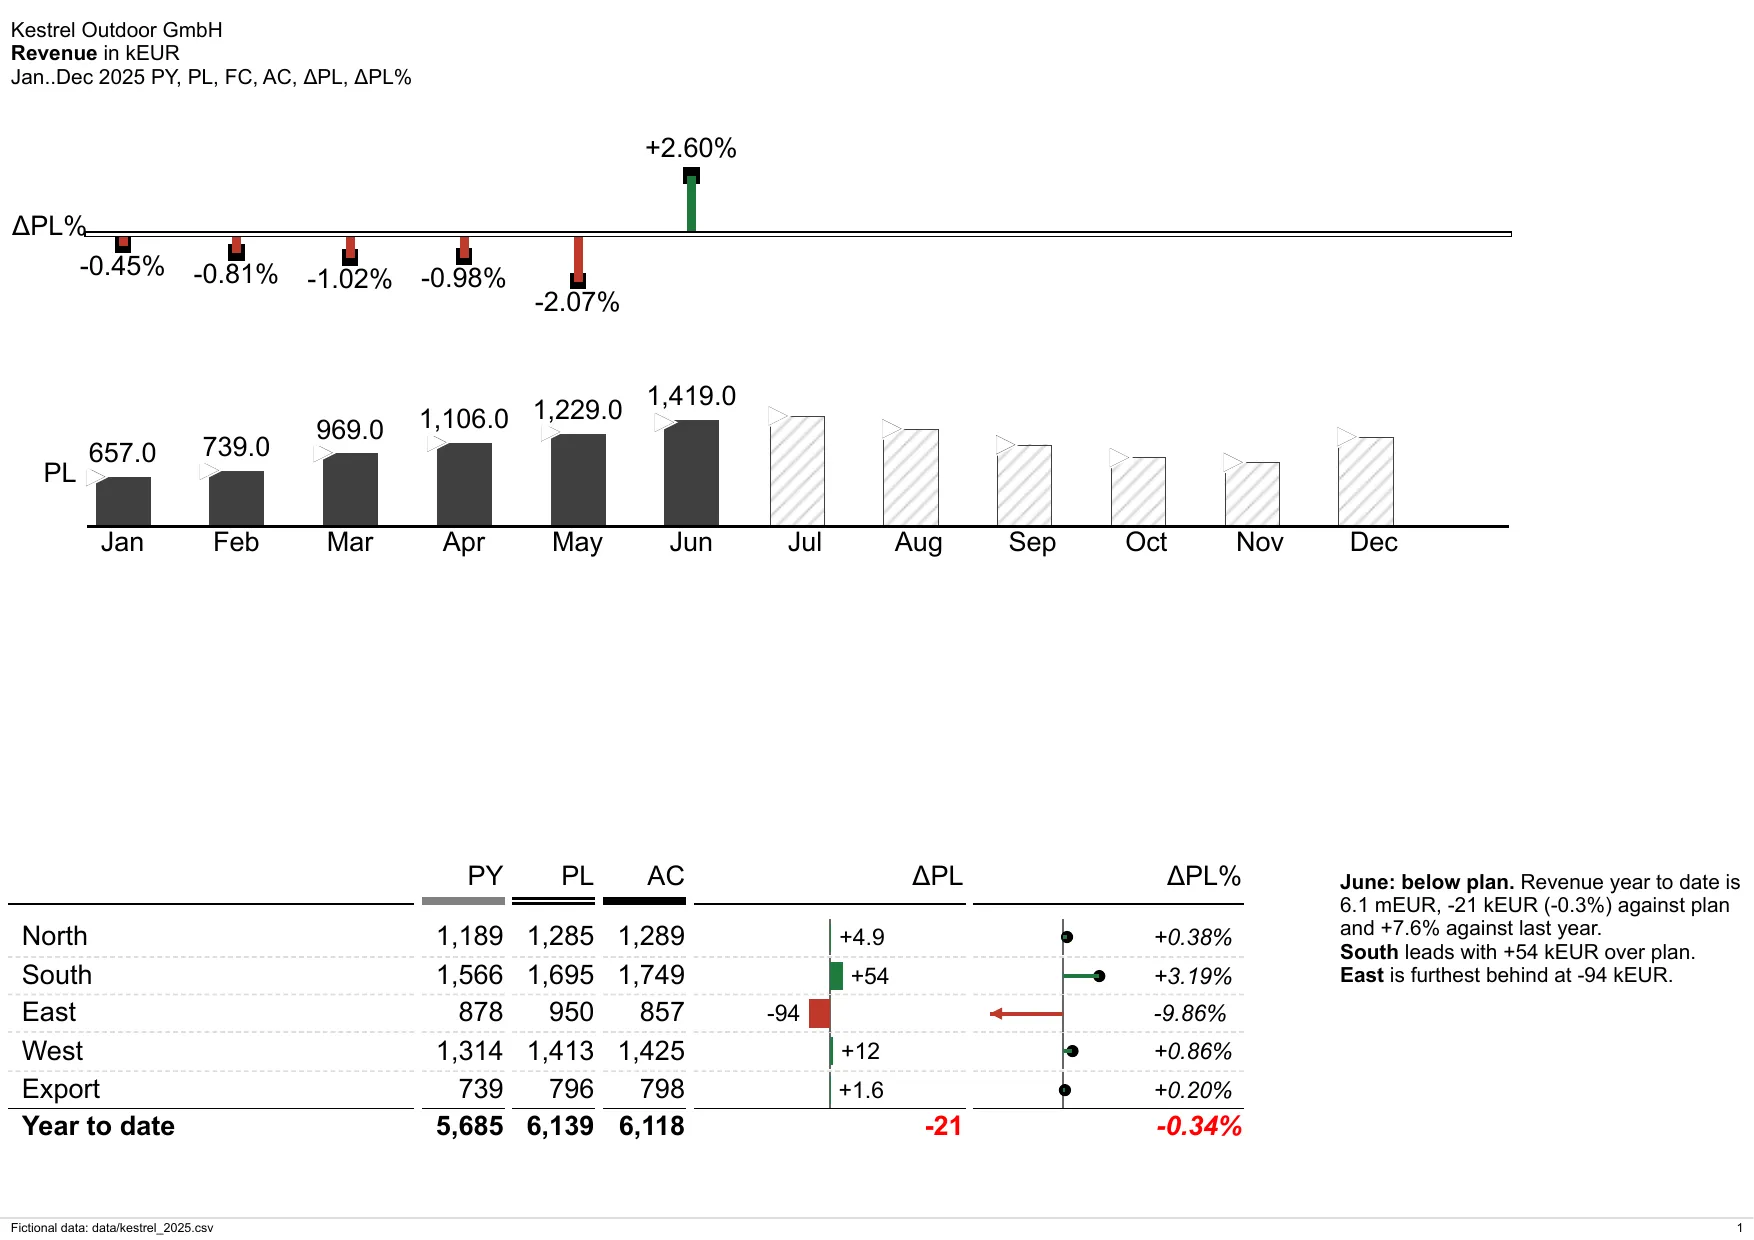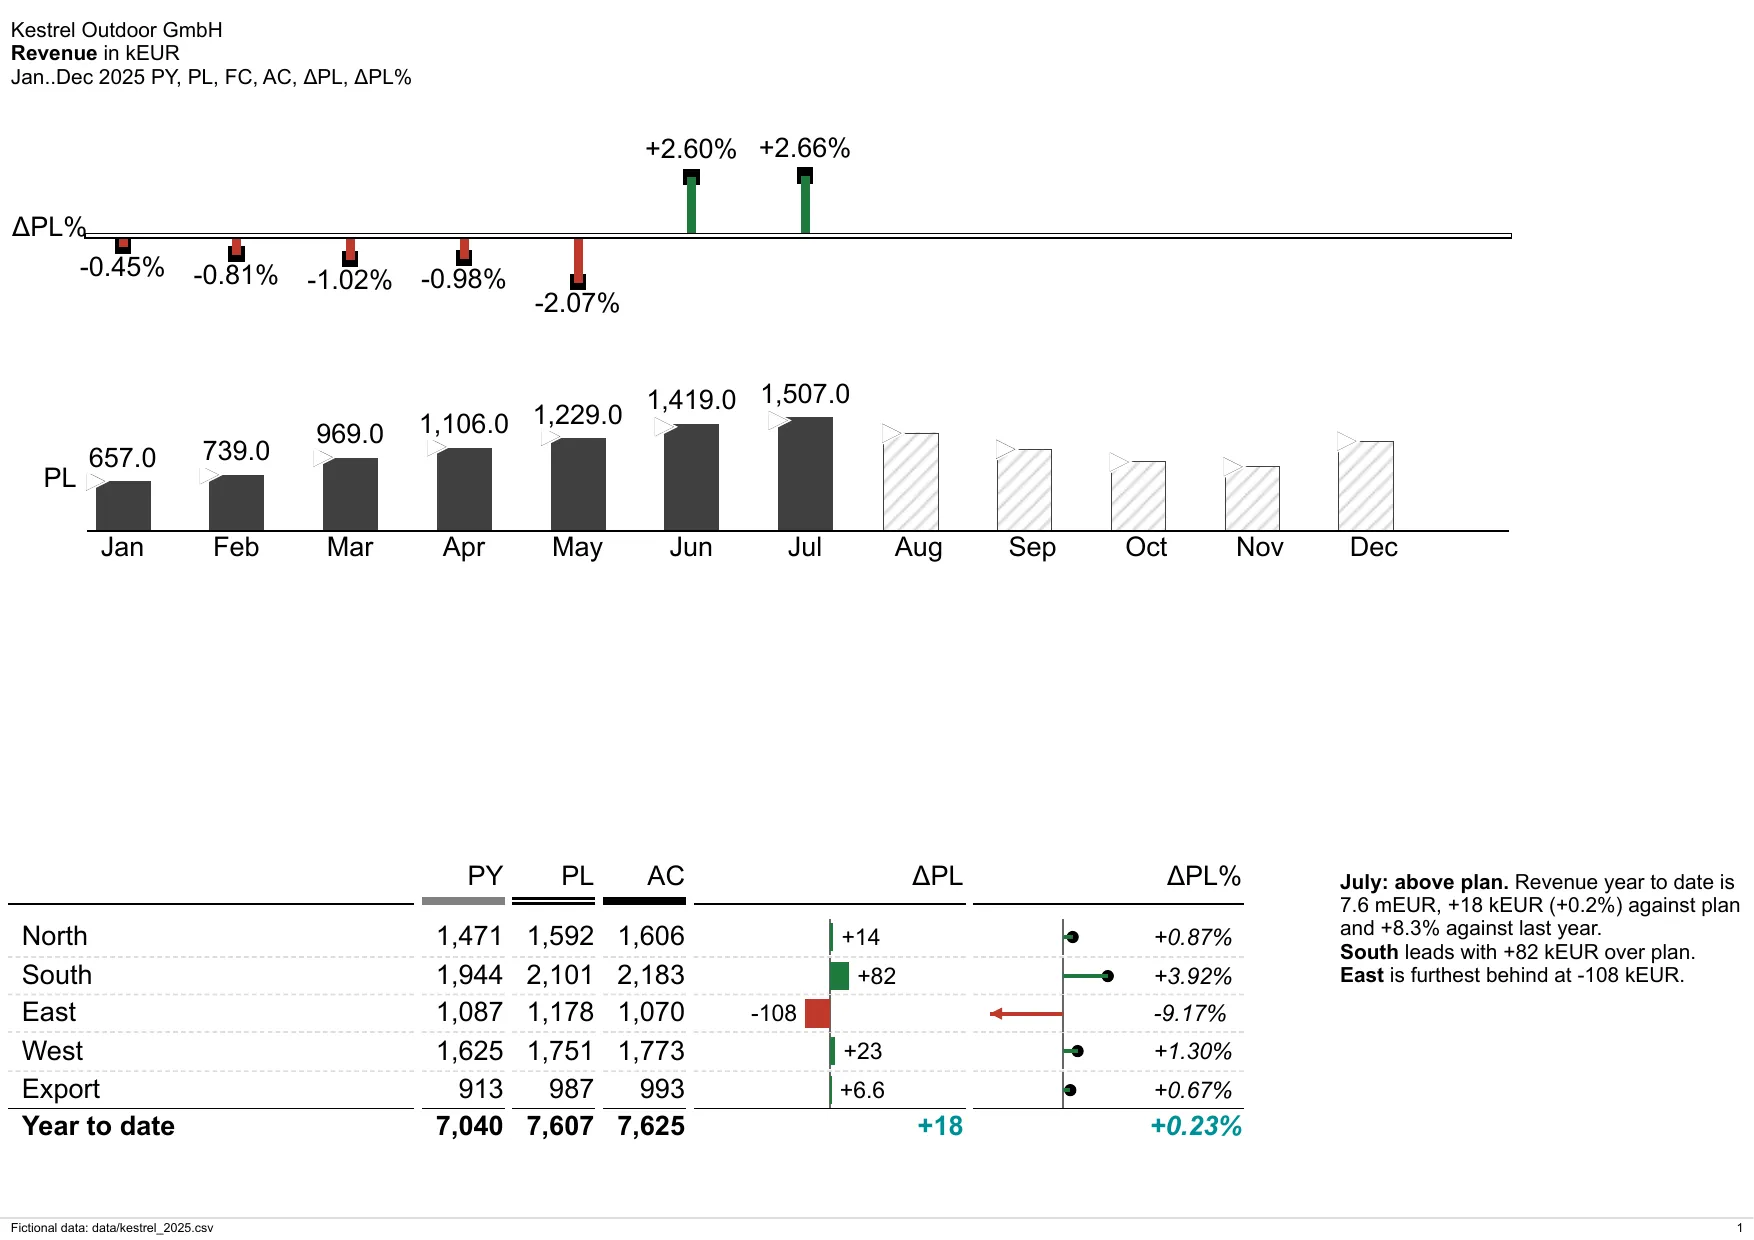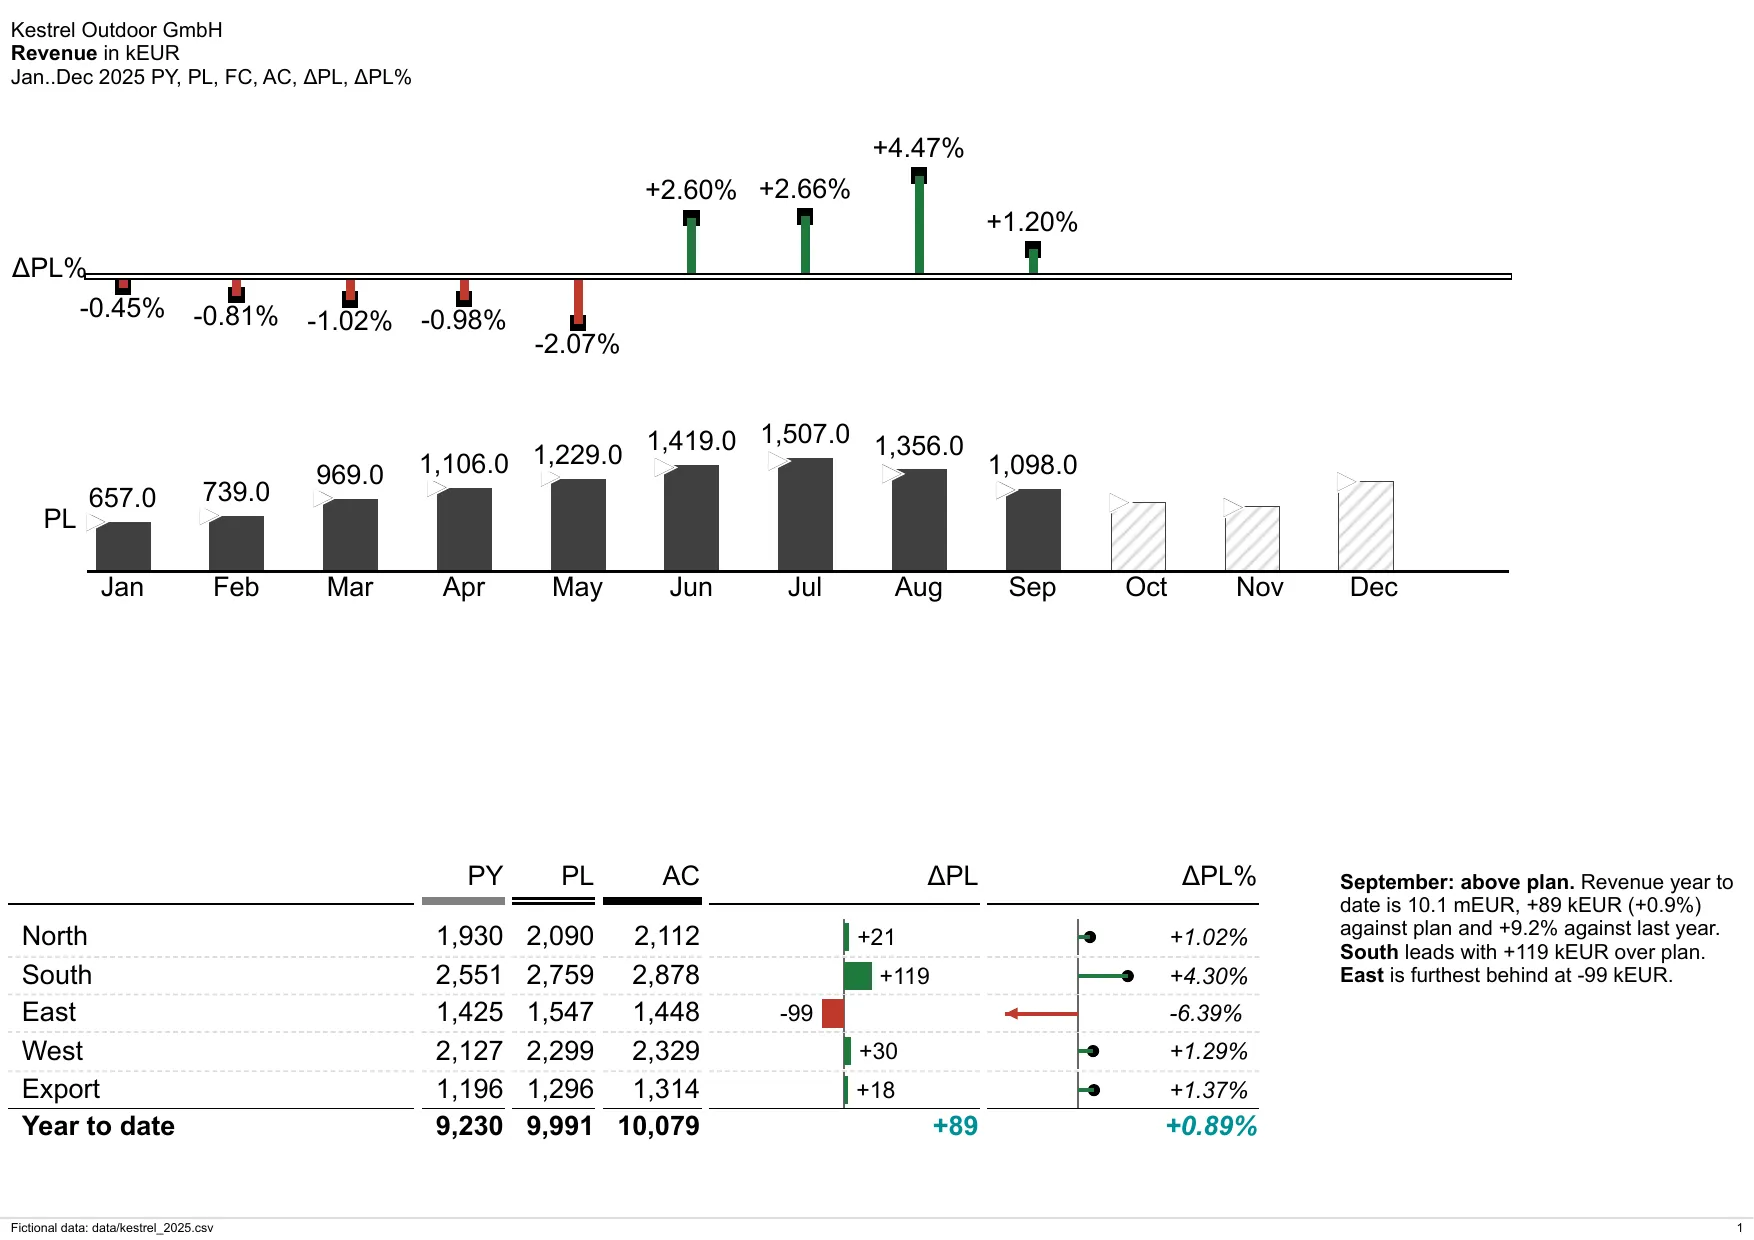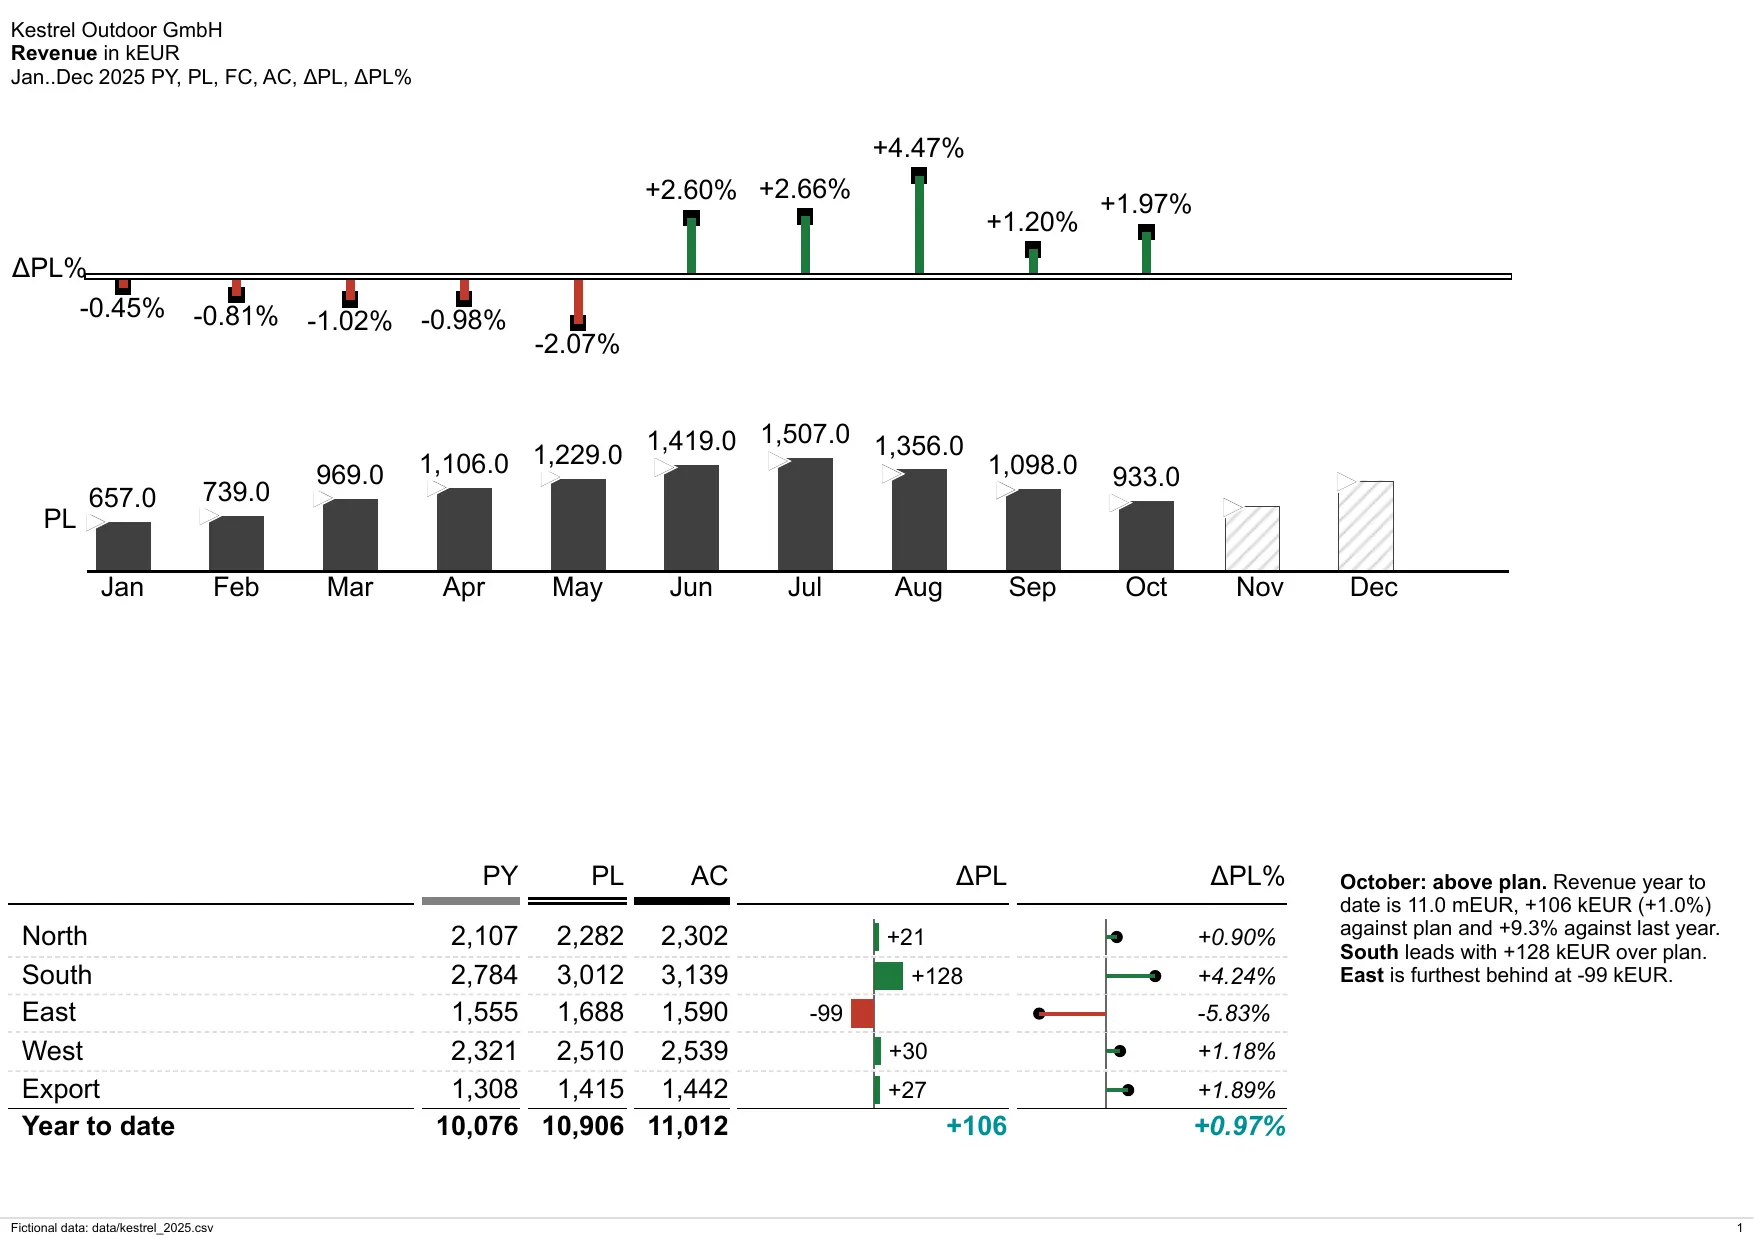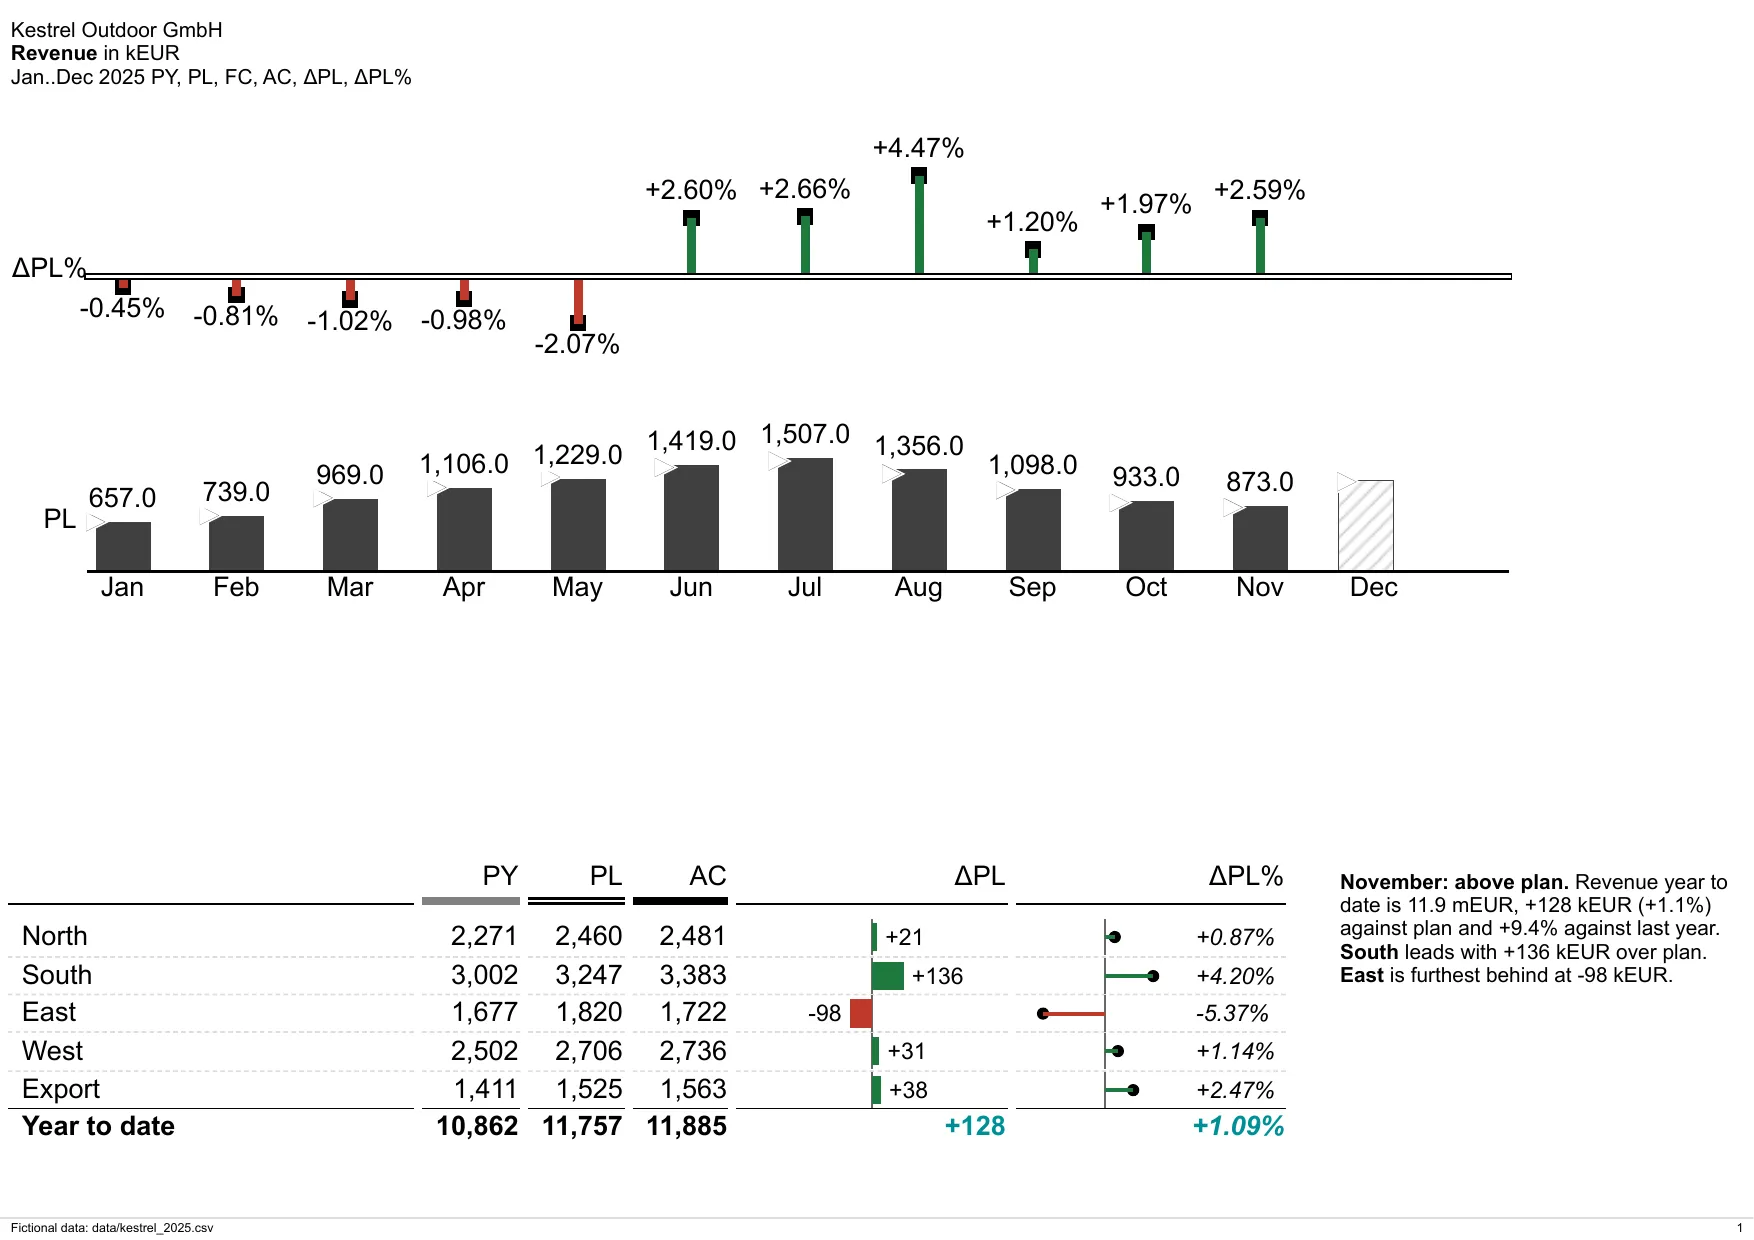
Step 1 of 4
Point bino at the data
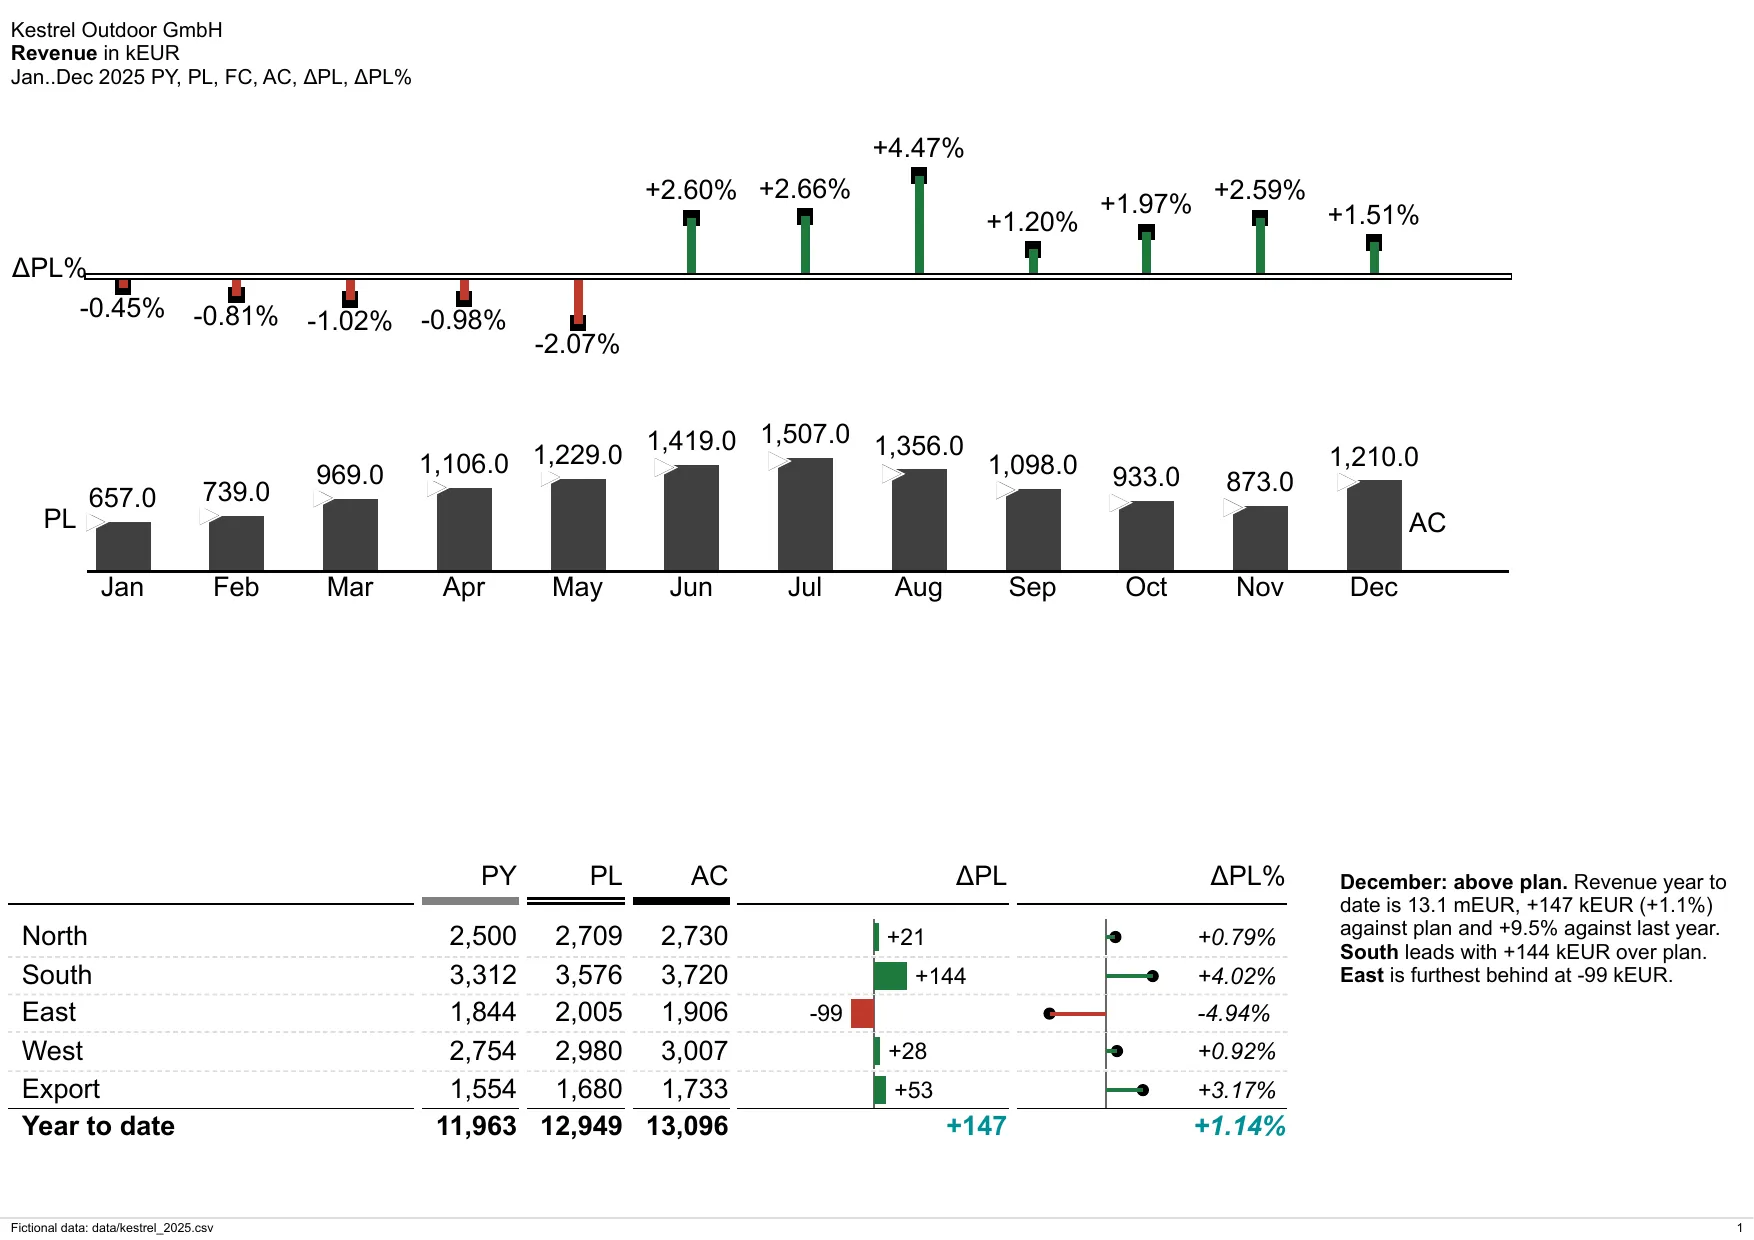
A DataSource names a file, a database or a URL. bino loads it under its name into the included query engine, powered by DuckDB. Here it is one CSV file with 240 rows: month, region, product line, and revenue and cost of goods as actual, plan and last year.
datasources/kestrel.yaml
apiVersion: bino.bi/v1alpha1
kind: DataSource
metadata:
  name: kestrel
  description: Fictional monthly revenue and cost of goods 2025 (AC, PY, PL) of Kestrel Outdoor GmbH
spec:
  type: csv
path: ../data/kestrel_2025.csv| month | region | product | revenue_ac | revenue_py | revenue_pl | cogs_ac | cogs_py | cogs_pl |
|---|---|---|---|---|---|---|---|---|
| 2025-01-01 | North | Tents | 47200 | 43500 | 46900 | 27400 | 25500 | 27200 |
| 2025-01-01 | North | Backpacks | 36400 | 33800 | 37300 | 19300 | 17800 | 19400 |
| 2025-01-01 | North | Apparel | 30400 | 30800 | 33100 | 14200 | 14600 | 15600 |
| 2025-01-01 | North | Footwear | 21000 | 18600 | 20700 | 11800 | 10300 | 11400 |
| 2025-01-01 | South | Tents | 62600 | 55900 | 61900 | 33800 | 31100 | 34100 |
| 2025-01-01 | South | Backpacks | 51600 | 45500 | 49200 | 25200 | 22700 | 24300 |
| 2025-01-01 | South | Apparel | 43100 | 39700 | 43700 | 19600 | 17900 | 19500 |
| 2025-01-01 | South | Footwear | 28500 | 25900 | 27300 | 15100 | 13700 | 14300 |