
Agentic reporting · a real run
A report written by an AI agent
We gave an agent a CSV file and one question. It had no editor and no shell, only the tools of bino mcp. A person reviewed the PDF twice. Everything it did is on this page.
The task
One question, one rule
The input is 60 rows of generated test data: monthly revenue 2025 for a fictional company, by region, actual and plan. Claude Code ran in headless mode with only the bino MCP tools allowed, so every manifest in the project was written through bino’s own validation.
- bino mcp as the only MCP server, standalone (
--no-proxy) - No file, edit or shell tools; only
mcp__bino__*and reading MCP resources - No user settings or memory loaded (
--setting-sources project) - Model
claude-opus-5-5, Claude Code 2.1.306, bino 0.100.0
You are working in a bino report project. The current directory is the project root
(it has a bino.toml). The only input is `data/sales_2025.csv`: monthly revenue in EUR for
Kestrel Outdoor GmbH in 2025, per sales region (North, South, East, West, Export), as
actual and as plan.

Build a one-page IBCS report for the monthly management meeting that answers:
"Did we hit the 2025 revenue plan, and which region drives the deviation?"

The page should have:
- a message title that states the main finding, taken from the data,
- a chart of actual vs. plan by month with the plan variance,
- a table by region with actual, plan and the variance to plan (absolute and relative),
- one or two short sentences of commentary that are true for this data.

Rules:
- Work only through the bino MCP tools. You have no file or shell tools.
- Read the bino://skills/bino-concepts, bino://skills/bino-authoring and
  bino://skills/bino-ibcs resources first.
- Use introspect_source on the CSV before you write the DataSource.
- Check every manifest with validate_draft before you write it, and check the data
  of your DataSets with get_rows.
- Name the ReportArtefact `sales_2025_report` and render it with the build tool.
- After the build, call get_layout_state and fix what it reports. Rebuild until the
  page is clean.
- End with a short summary: the files you wrote and the main finding.
How it went
Three turns, two reviews
The agent cannot see the PDF. After each build a person looked at it and wrote down what was wrong. That is the same loop the bino Claude Code plugin asks for: “validates and builds” is not the same as “correct”.
The prompt
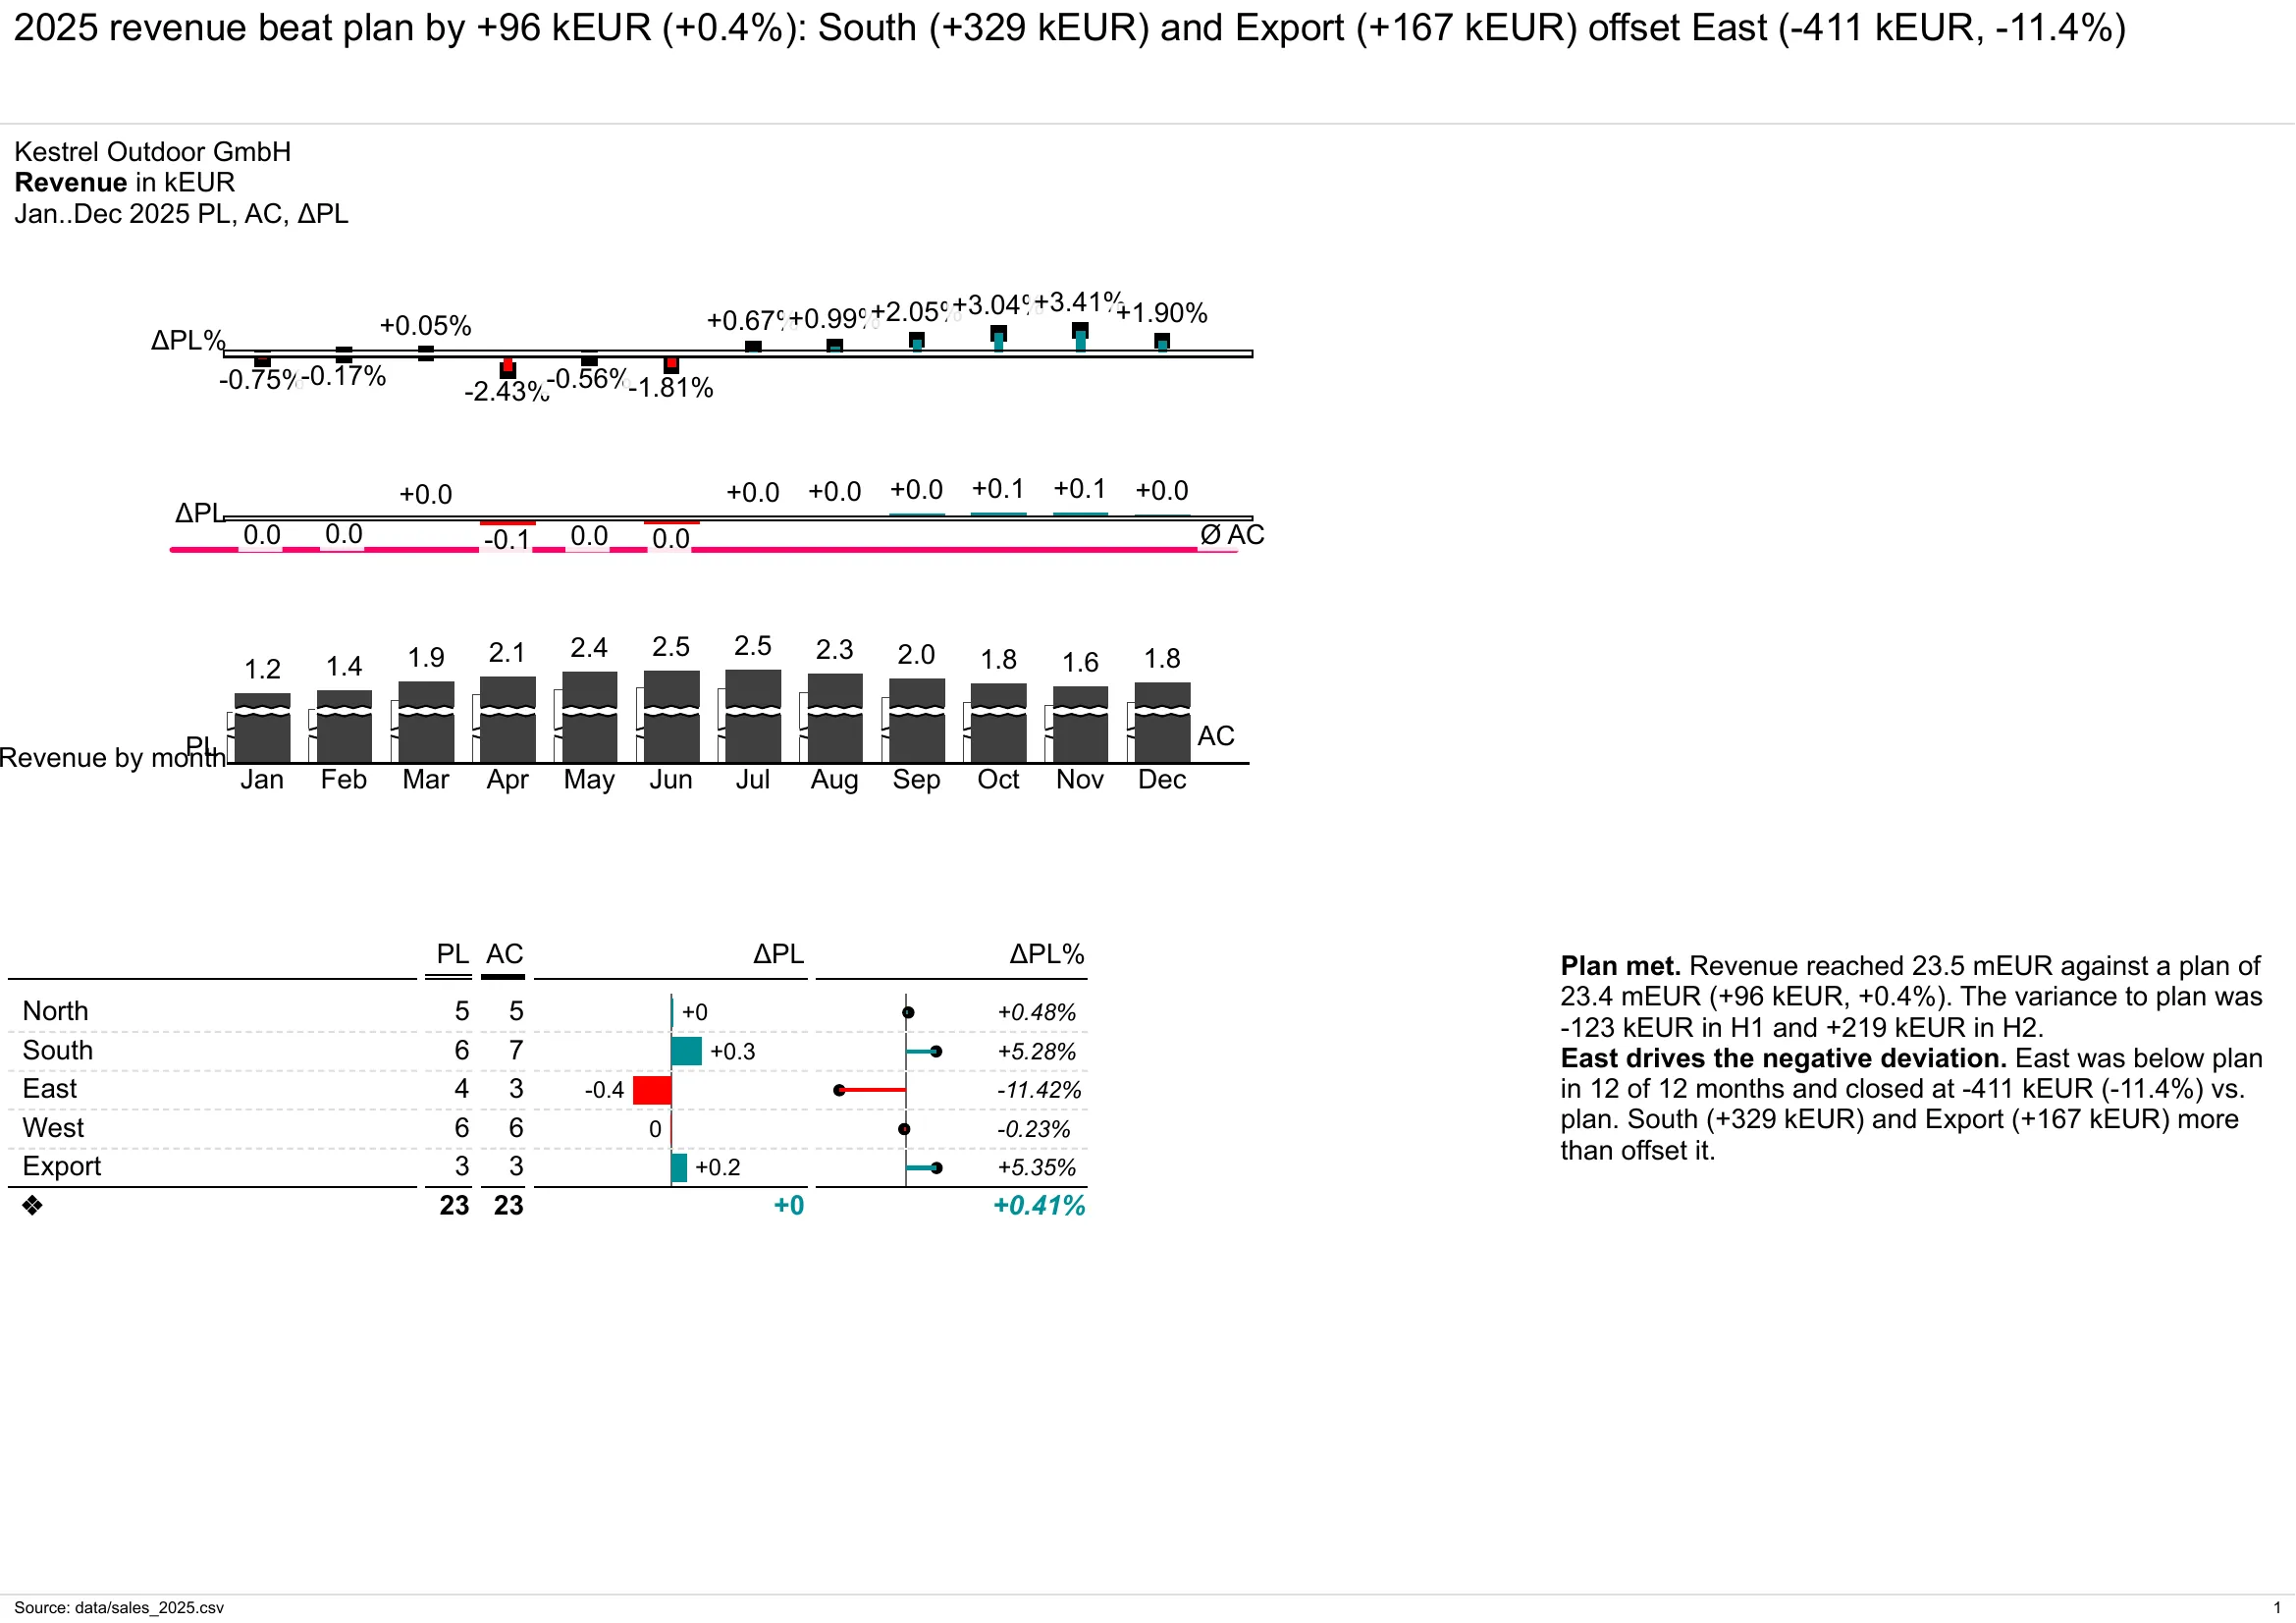
The agent read the bino skills, probed the CSV, wrote a DataSource, three DataSets, a page and the artefact, and built the PDF. get_layout_state found that the chart was far taller than its 320 px slot, and the agent fixed that over several builds. Every check passed, but the numbers on the page were in the wrong unit.
Review 1
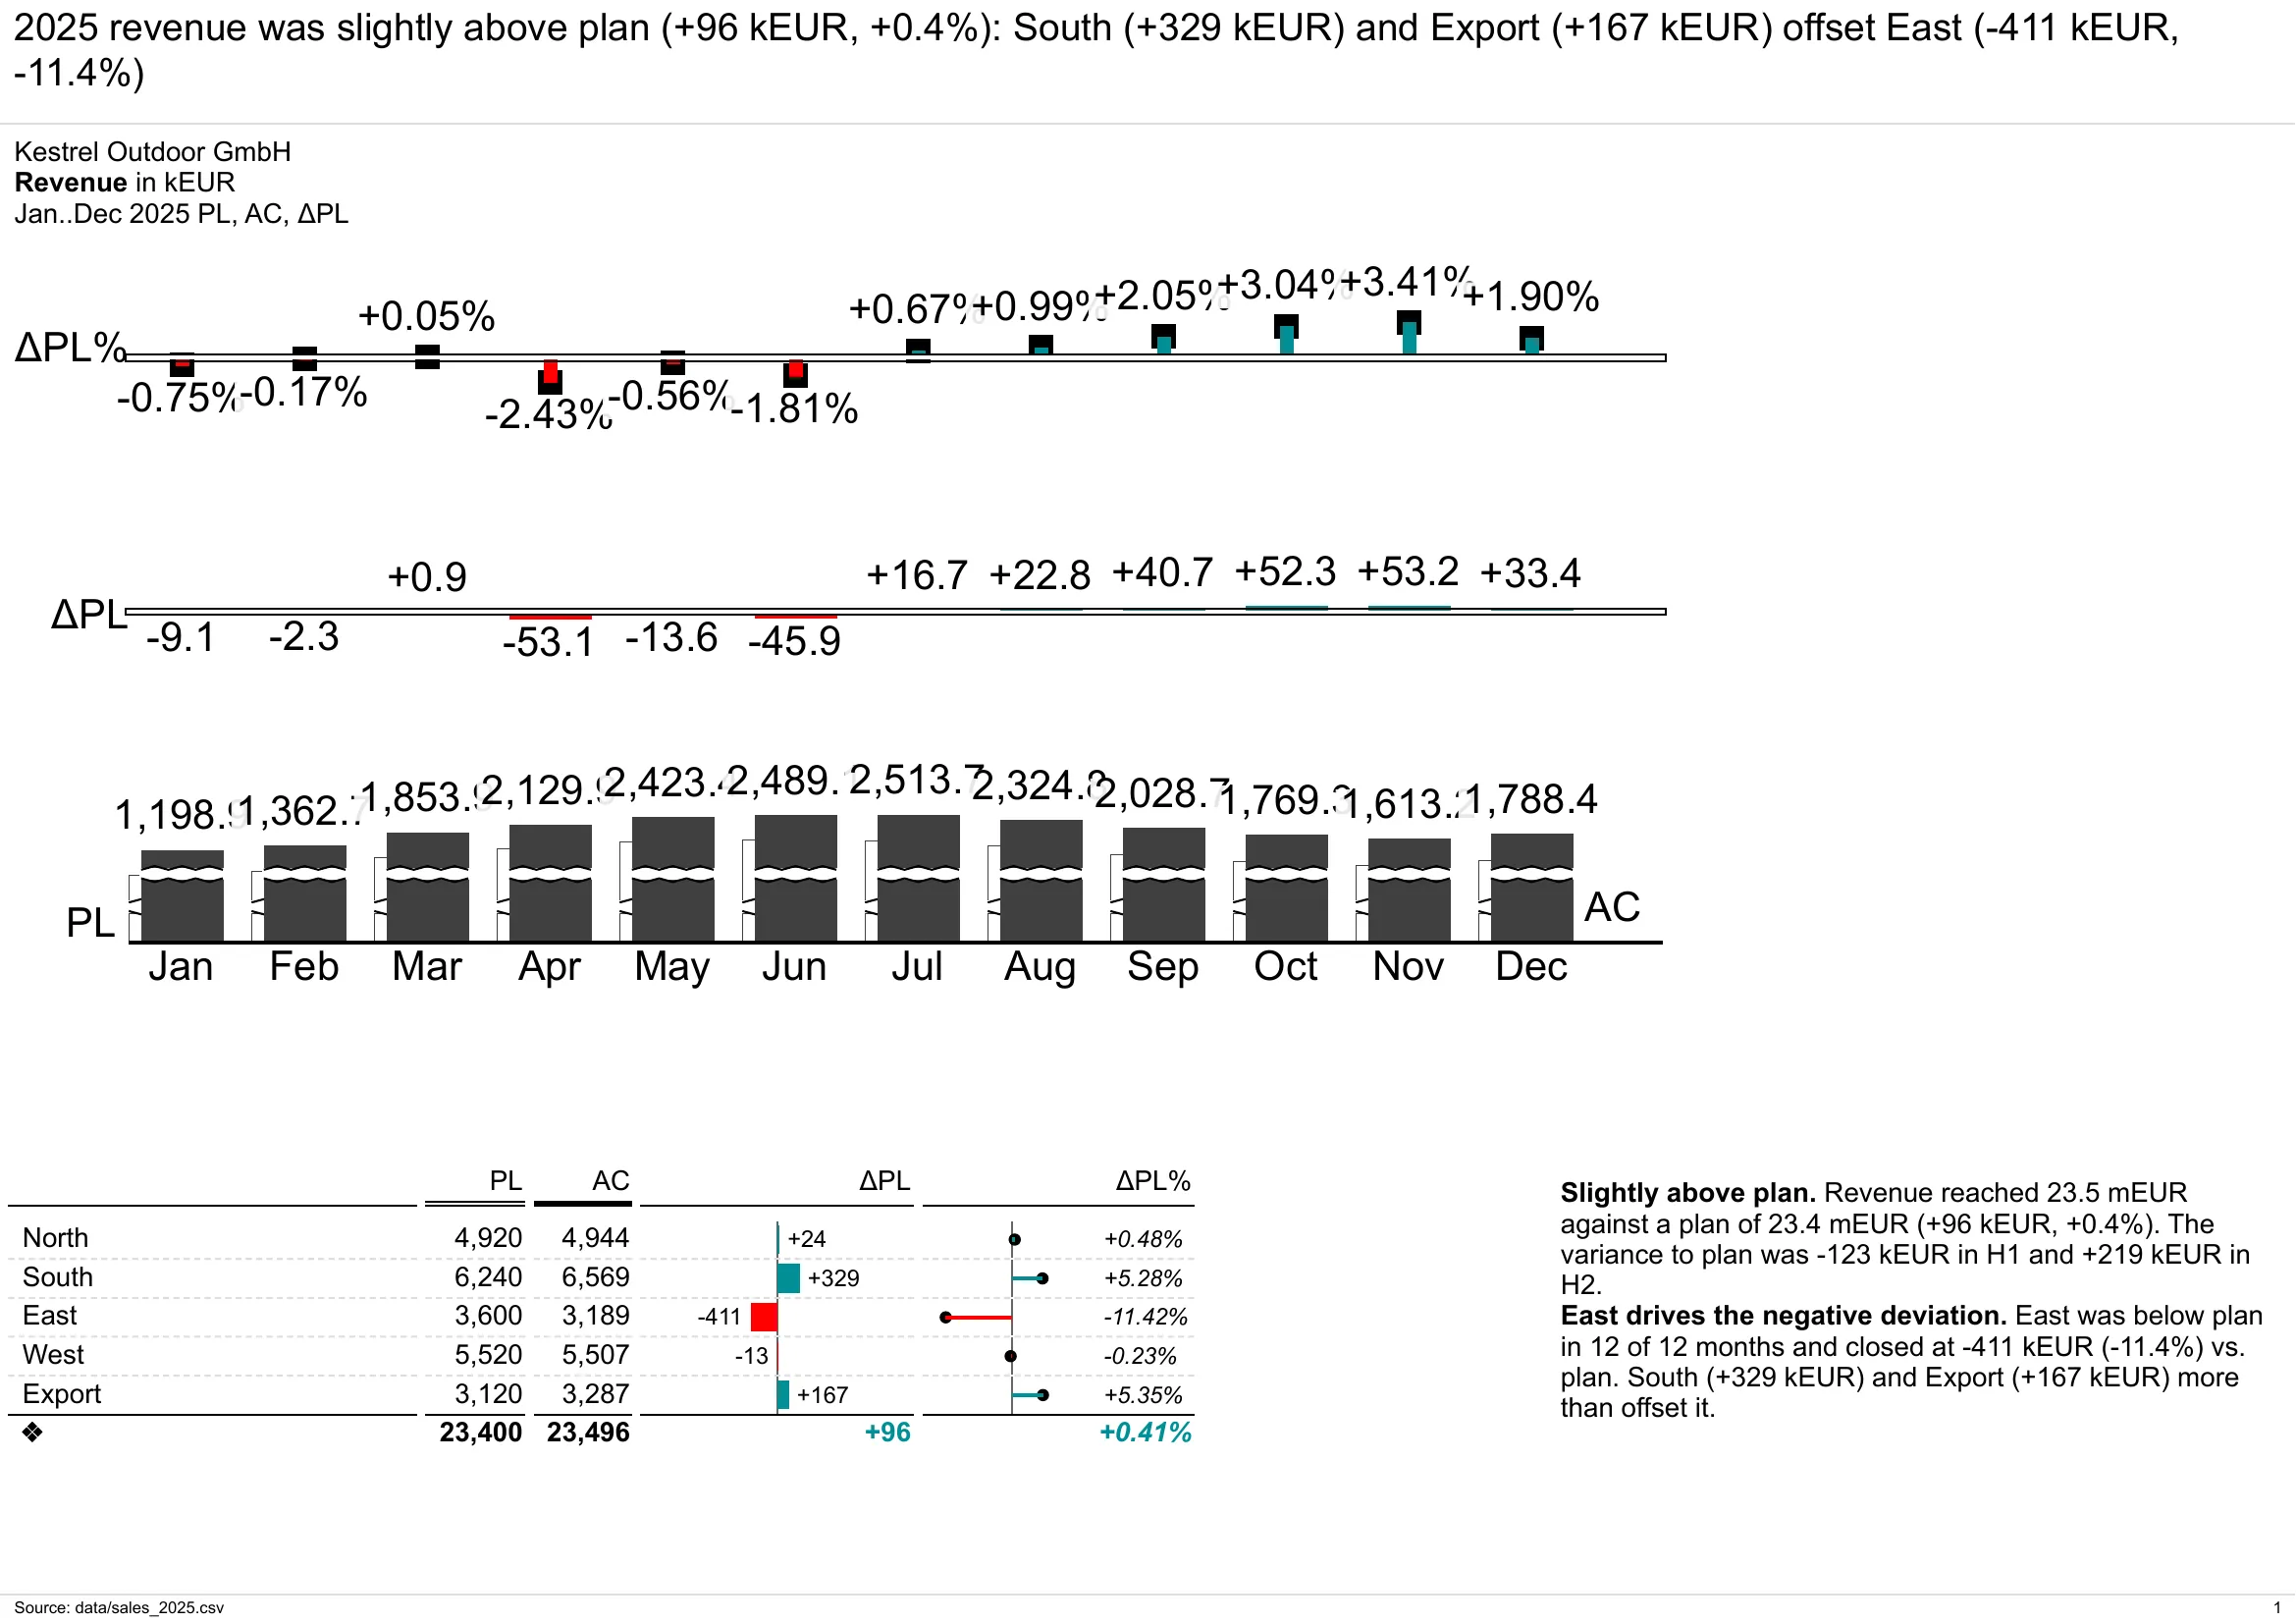
A person read the PDF and listed seven problems in plain words. The agent found the cause (the engine added its own unit prefix to values that were already in kEUR), fixed the units, removed an average line and used more of the page.
Review 2
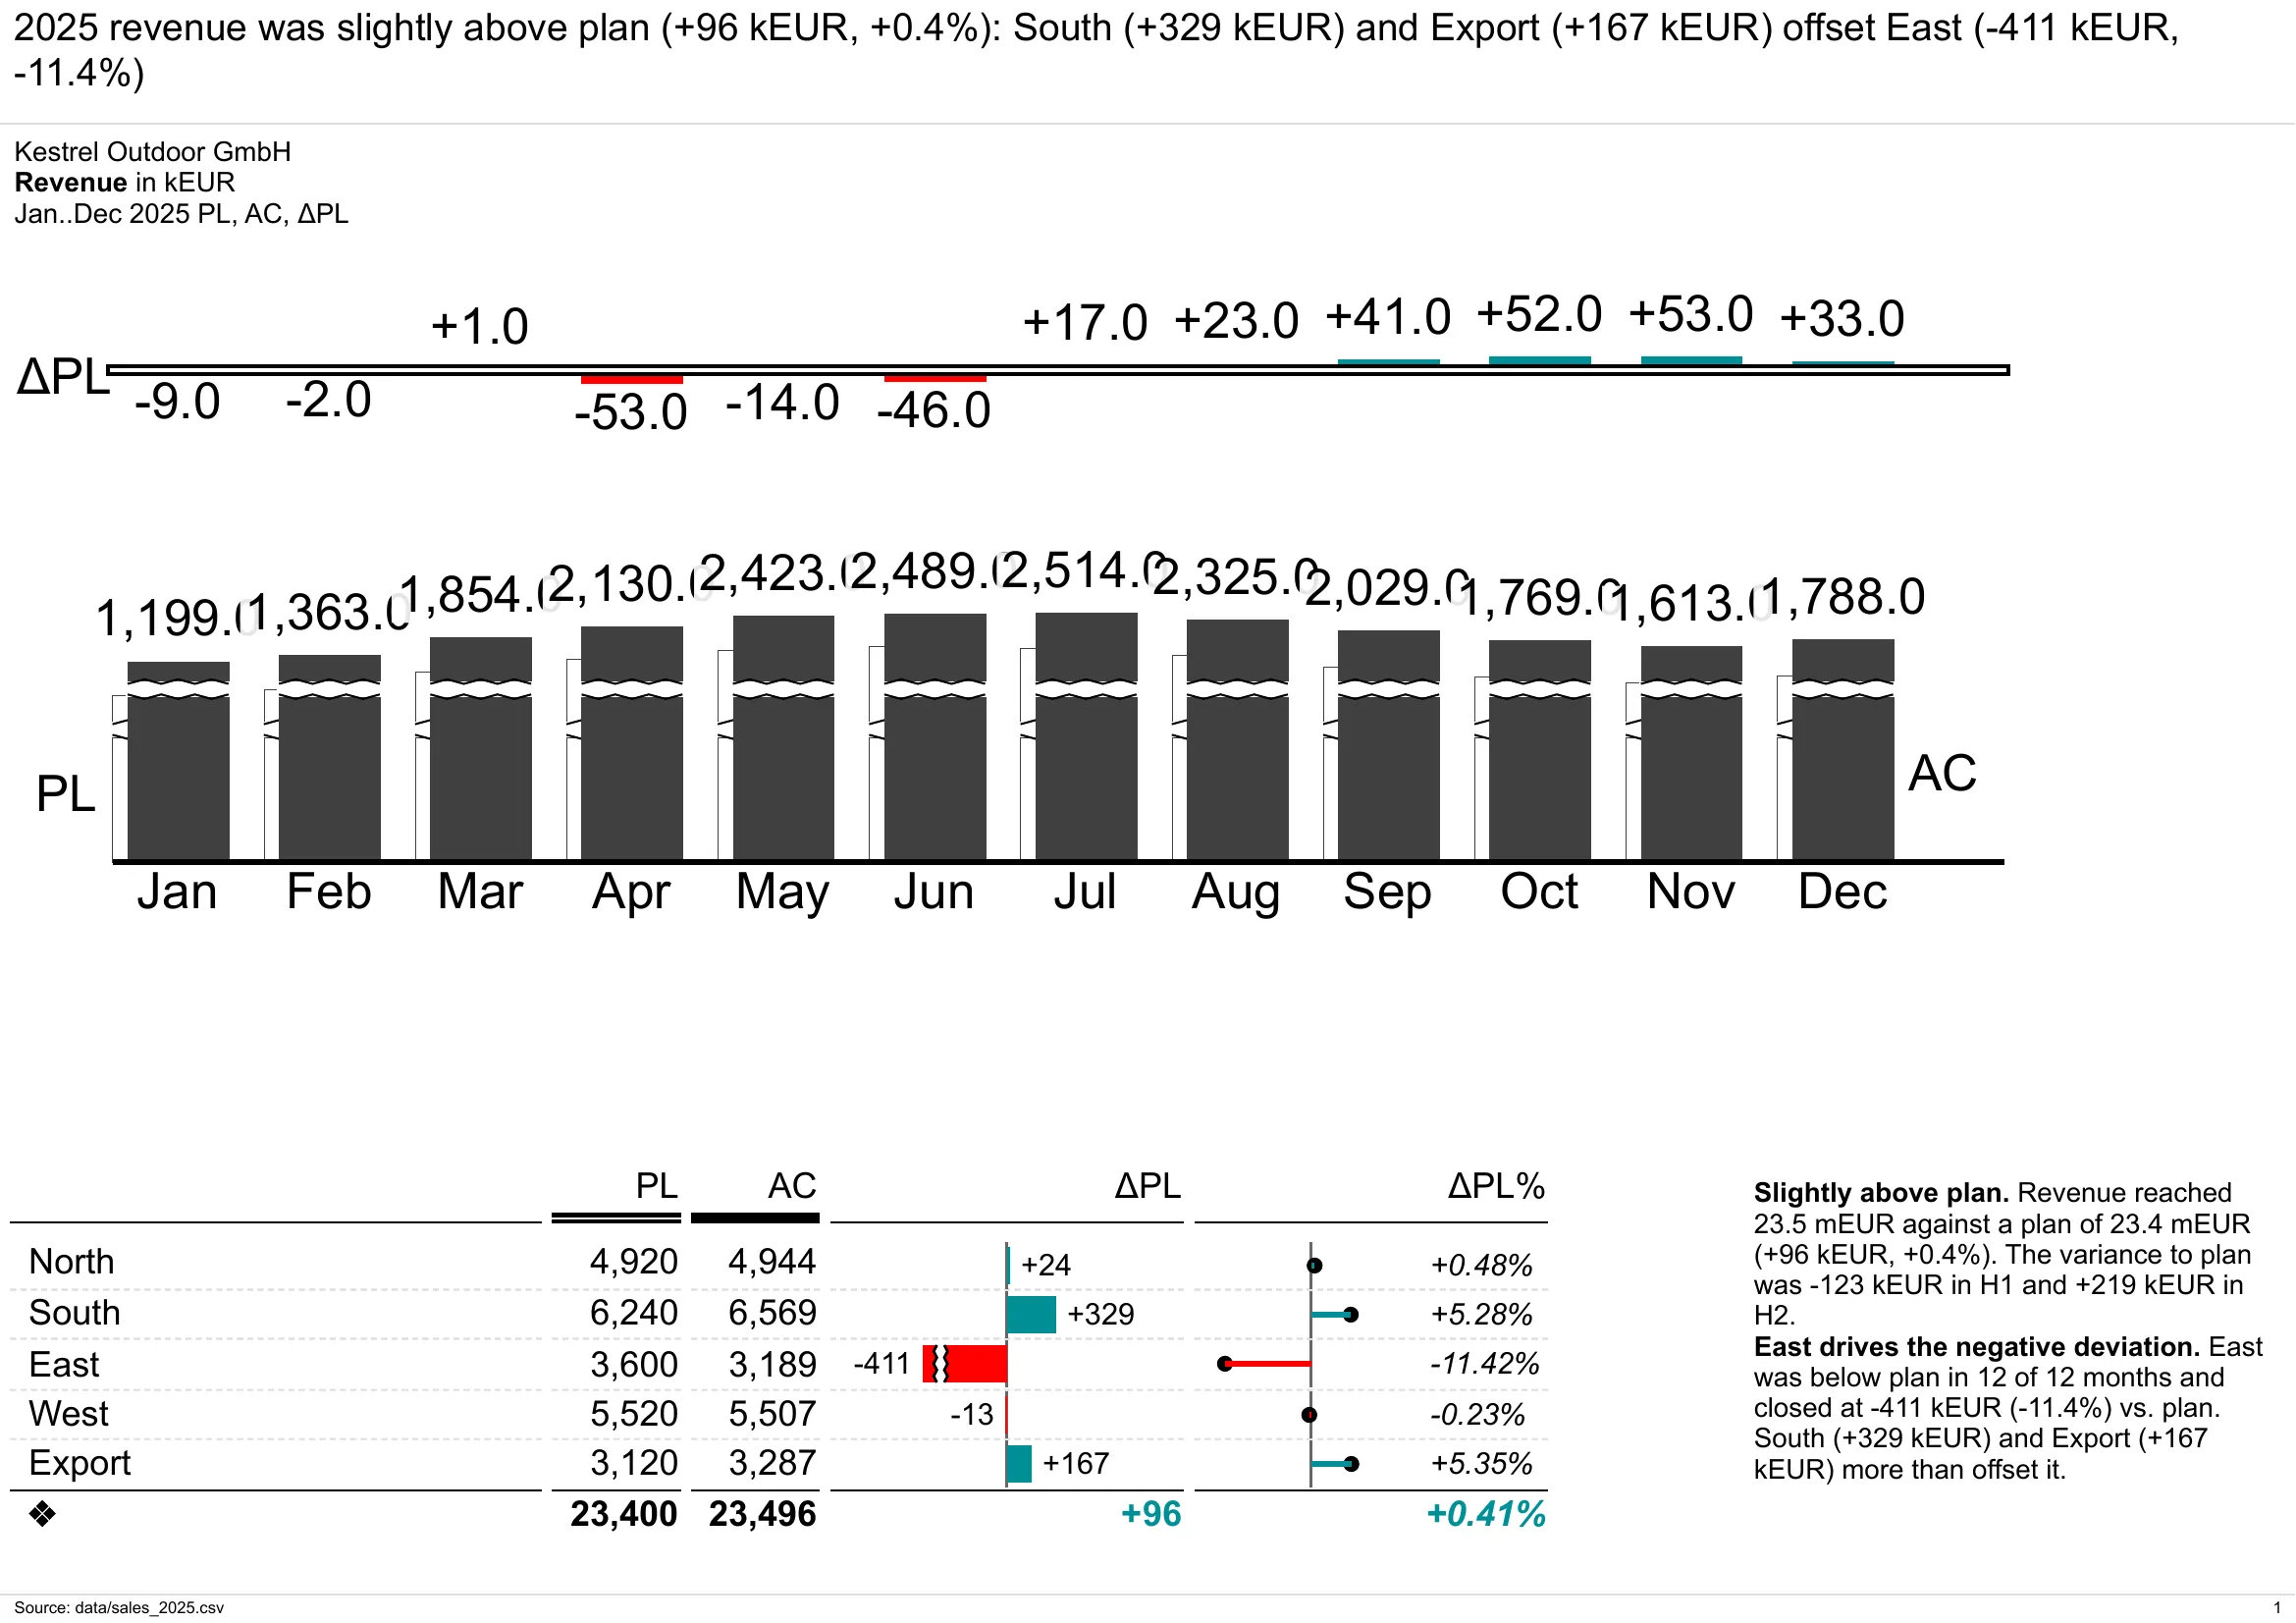
Three points were left: decimals in the chart, overlapping percent labels, and unused space. The agent rounded the monthly values, dropped the relative variance from the chart and kept it in the table, and used the full width.
I opened the PDF. It builds, but I would not send it to the management meeting yet:

1. The numbers do not match the unit. The header says kEUR, but the chart labels show
   1.2 to 2.5 and the table shows 5, 6, 23. A reader cannot tell what unit they see.
2. The absolute variance row (ΔPL) in the chart shows +0.0, 0.0 and -0.1. It tells the
   reader nothing.
3. A pink line with the label "Ø AC" runs through the ΔPL row. I do not know what it
   means here. Remove it unless it carries a message.
4. Labels overlap: several ΔPL% labels run into each other, and "Revenue by month"
   sits on top of "PL".
5. The chart uses about half the page width and the bottom third of the page is
   empty. Use the space.
6. The total row of the table shows +0 for ΔPL, but the total variance is +96 kEUR.
7. "Plan met" is too strong for +0.4%. Say it more carefully.

Fix these with the same tools, rebuild, run get_layout_state again, and tell me what
you changed. If something is an engine limit and you need a workaround, say so.Much better. The units, the table and the wording are right now. Three things are left:
1. The monthly values in the chart have a decimal (1,198.9, 2,129.5 ...). The labels are
cut off and run into each other. Show whole kEUR, like in the table.
2. The ΔPL% labels still overlap each other (for example -0.75% and -0.17%, +0.67% and
+0.99%). Make them readable.
3. The chart still stops at about 72% of the page width, and the area under the table is
empty. The chart and the table can both use more of the page.
Same rules as before: fix it with the tools, rebuild, run get_layout_state, and tell me
what you changed.The result
The final page
bino build from the manifests below.Open the PDF apiVersion: bino.bi/v1alpha1
kind: LayoutPage
metadata:
name: sales_2025_page
description: Revenue 2025 actual vs plan, by month and by region
spec:
pageFormat: a4
pageOrientation: landscape
pageLayout: custom-template
pageGridGap: "12"
titleBusinessUnit: Kestrel Outdoor GmbH
titleMeasures:
- name: Revenue
unit: kEUR
titleScenarios: [ac1, pl1]
titleVariances: [dac1_pl1_pos]
titleDateStart: "2025-01-01"
titleDateEnd: "2025-12-31"
titleDateFormat: month
titleDateLink: interval
titleOrder: categoryindex
messageText: '2025 revenue was slightly above plan (+96 kEUR, +0.4%): South (+329 kEUR) and Export (+167 kEUR) offset East (-411 kEUR, -11.4%)'
footerText: "Source: data/sales_2025.csv"
children:
- kind: ChartTime
spec:
dataset: sales_2025_monthly
dateInterval: month
scenarios: [ac1, pl1]
variances:
- dac1_pl1_pos
measureUnit: kEUR
unitScaling: 200
measureScale: _
scale: 1.85
showOverlayAvg: false
showOverlayMedian: false
percentageScaling: 4
- kind: Table
spec:
dataset: sales_2025_region
type: sum
order: categoryindex
orderDirection: asc
scenarios: [pl1, ac1]
variances: [dac1_pl1_pos, drac1_pl1_pos]
barColumns: [dac1_pl1_pos, drac1_pl1_pos]
measureType: currency
measureUnit: kEUR
percentageScaling: 4
unitScaling: 200
dataFormatDigitsDecimal: 0
measureScale: _
scale: 1.3
- kind: Text
spec:
dataset: sales_2025_kpi
value: |
**Slightly above plan.** Revenue reached ${data.sales_2025_kpi[0].ac_m} mEUR against a plan of ${data.sales_2025_kpi[0].pl_m} mEUR (${data.sales_2025_kpi[0].d_k} kEUR, ${data.sales_2025_kpi[0].dr_pct}%). The variance to plan was ${data.sales_2025_kpi[0].h1_d_k} kEUR in H1 and ${data.sales_2025_kpi[0].h2_d_k} kEUR in H2.
**East drives the negative deviation.** East was below plan in ${data.sales_2025_kpi[0].east_months_below} of 12 months and closed at ${data.sales_2025_kpi[0].east_d_k} kEUR (${data.sales_2025_kpi[0].east_dr_pct}%) vs. plan. South (${data.sales_2025_kpi[0].south_d_k} kEUR) and Export (${data.sales_2025_kpi[0].export_d_k} kEUR) more than offset it.
pageCustomTemplate: '"a a a a" "a a a a" "b b b c"'apiVersion: bino.bi/v1alpha1
kind: DataSet
metadata:
name: sales_2025_monthly
description: Total revenue per month 2025 in whole kEUR, actual (ac1) vs plan (pl1)
spec:
dependencies: [sales_2025_csv]
query: |
-- kEUR in the data: ChartTime does not apply measureScale to variance bars
-- rounded because ChartTime has no setting for label digits
SELECT
strftime(CAST(month AS DATE), '%Y-%m-%d') AS date,
ROUND(SUM(revenue_actual_eur) / 1000.0) AS ac1,
ROUND(SUM(revenue_plan_eur) / 1000.0) AS pl1
FROM sales_2025_csv
GROUP BY 1
ORDER BY 1
---
apiVersion: bino.bi/v1alpha1
kind: DataSet
metadata:
name: sales_2025_region
description: Revenue 2025 per region in kEUR, actual (ac1) vs plan (pl1)
spec:
dependencies: [sales_2025_csv]
query: |
SELECT
region AS category,
CASE region WHEN 'North' THEN 1 WHEN 'South' THEN 2 WHEN 'East' THEN 3
WHEN 'West' THEN 4 WHEN 'Export' THEN 5 END AS categoryIndex,
SUM(revenue_actual_eur) / 1000.0 AS ac1,
SUM(revenue_plan_eur) / 1000.0 AS pl1
FROM sales_2025_csv
GROUP BY region
ORDER BY categoryIndex
---
apiVersion: bino.bi/v1alpha1
kind: DataSet
metadata:
name: sales_2025_kpi
description: One row of formatted key figures for the page title and commentary
spec:
dependencies: [sales_2025_csv]
query: |
WITH r AS (
SELECT region,
SUM(revenue_actual_eur) AS ac,
SUM(revenue_plan_eur) AS pl,
SUM(revenue_actual_eur) - SUM(revenue_plan_eur) AS d
FROM sales_2025_csv
GROUP BY region
),
t AS (SELECT SUM(ac) AS ac, SUM(pl) AS pl, SUM(d) AS d FROM r),
h AS (
SELECT
SUM(CASE WHEN month(month) <= 6 THEN revenue_actual_eur - revenue_plan_eur END) AS d_h1,
SUM(CASE WHEN month(month) > 6 THEN revenue_actual_eur - revenue_plan_eur END) AS d_h2
FROM sales_2025_csv
),
east_months AS (
SELECT COUNT(*) FILTER (WHERE revenue_actual_eur < revenue_plan_eur) AS below
FROM sales_2025_csv WHERE region = 'East'
)
SELECT
printf('%.1f', t.ac / 1e6) AS ac_m,
printf('%.1f', t.pl / 1e6) AS pl_m,
printf('%+.0f', t.d / 1e3) AS d_k,
printf('%+.1f', 100.0 * t.d / t.pl) AS dr_pct,
(SELECT printf('%+.0f', d / 1e3) FROM r WHERE region = 'East') AS east_d_k,
(SELECT printf('%+.1f', 100.0 * d / pl) FROM r WHERE region = 'East') AS east_dr_pct,
(SELECT printf('%+.0f', d / 1e3) FROM r WHERE region = 'South') AS south_d_k,
(SELECT printf('%+.0f', d / 1e3) FROM r WHERE region = 'Export') AS export_d_k,
printf('%+.0f', h.d_h1 / 1e3) AS h1_d_k,
printf('%+.0f', h.d_h2 / 1e3) AS h2_d_k,
east_months.below AS east_months_below
FROM t, h, east_monthsThe transcript
Every tool call
In order, as recorded. A red mark means the call failed, or bino’s answer contained an error or a warning.
validate_draft × 17edit_manifest × 14get_layout_state × 12get_rows × 9build × 9outline_kind × 8validate_project × 8write_manifest × 6ReadMcpResourceTool × 3remove_manifest_fields × 3describe_project × 1introspect_source × 1list_kinds × 1describe_kind × 1Show all 93 calls
| # | Turn | Tool | Argument | Result |
|---|---|---|---|---|
| 1 | 1 | ReadMcpResourceTool | bino://skills/bino-concepts | ok |
| 2 | 1 | ReadMcpResourceTool | bino://skills/bino-authoring | ok |
| 3 | 1 | ReadMcpResourceTool | bino://skills/bino-ibcs | ok |
| 4 | 1 | describe_project | ok | |
| 5 | 1 | introspect_source | data/sales_2025.csv | ok |
| 6 | 1 | outline_kind | DataSource | ok |
| 7 | 1 | outline_kind | DataSet | ok |
| 8 | 1 | list_kinds | ok | |
| 9 | 1 | validate_draft | DataSource | ok |
| 10 | 1 | write_manifest | datasources/sales_2025_csv.yaml | ok |
| 11 | 1 | get_rows | $sales_2025_csv | error or warning |
| 12 | 1 | validate_project | error or warning | |
| 13 | 1 | edit_manifest | datasources/sales_2025_csv.yaml | ok |
| 14 | 1 | get_rows | $sales_2025_csv | ok |
| 15 | 1 | validate_draft | DataSet | ok |
| 16 | 1 | write_manifest | datasets/sales_2025.yaml | ok |
| 17 | 1 | write_manifest | datasets/sales_2025.yaml | ok |
| 18 | 1 | get_rows | sales_2025_monthly | ok |
| 19 | 1 | get_rows | sales_2025_region | ok |
| 20 | 1 | validate_draft | DataSet | ok |
| 21 | 1 | write_manifest | datasets/sales_2025.yaml | ok |
| 22 | 1 | get_rows | sales_2025_kpi | ok |
| 23 | 1 | outline_kind | ChartTime | ok |
| 24 | 1 | outline_kind | Table | ok |
| 25 | 1 | outline_kind | Text | ok |
| 26 | 1 | outline_kind | LayoutPage | ok |
| 27 | 1 | outline_kind | ReportArtefact | ok |
| 28 | 1 | validate_draft | LayoutPage | error or warning |
| 29 | 1 | validate_draft | LayoutPage | ok |
| 30 | 1 | write_manifest | pages/sales_2025_page.yaml | ok |
| 31 | 1 | validate_draft | ReportArtefact | ok |
| 32 | 1 | write_manifest | reports/sales_2025_report.yaml | ok |
| 33 | 1 | validate_project | error or warning | |
| 34 | 1 | validate_project | ok | |
| 35 | 1 | build | sales_2025_report | ok |
| 36 | 1 | get_layout_state | sales_2025_report | error or warning |
| 37 | 1 | edit_manifest | pages/sales_2025_page.yaml | ok |
| 38 | 1 | validate_draft | LayoutPage | ok |
| 39 | 1 | edit_manifest | pages/sales_2025_page.yaml | ok |
| 40 | 1 | build | sales_2025_report | ok |
| 41 | 1 | get_layout_state | sales_2025_report | error or warning |
| 42 | 1 | get_layout_state | sales_2025_report | tool error |
| 43 | 1 | validate_draft | DataSet | ok |
| 44 | 1 | edit_manifest | datasets/sales_2025.yaml | ok |
| 45 | 1 | edit_manifest | datasets/sales_2025.yaml | ok |
| 46 | 1 | remove_manifest_fields | pages/sales_2025_page.yaml | ok |
| 47 | 1 | validate_draft | LayoutPage | ok |
| 48 | 1 | edit_manifest | pages/sales_2025_page.yaml | ok |
| 49 | 1 | get_rows | sales_2025_region | ok |
| 50 | 1 | get_rows | sales_2025_monthly | ok |
| 51 | 1 | validate_project | ok | |
| 52 | 1 | build | sales_2025_report | ok |
| 53 | 1 | get_layout_state | sales_2025_report | error or warning |
| 54 | 1 | validate_draft | LayoutPage | ok |
| 55 | 1 | edit_manifest | pages/sales_2025_page.yaml | ok |
| 56 | 1 | build | sales_2025_report | ok |
| 57 | 1 | get_layout_state | sales_2025_report | error or warning |
| 58 | 1 | get_layout_state | sales_2025_report | tool error |
| 59 | 1 | validate_draft | LayoutPage | ok |
| 60 | 1 | edit_manifest | pages/sales_2025_page.yaml | ok |
| 61 | 1 | build | sales_2025_report | ok |
| 62 | 1 | get_layout_state | sales_2025_report | ok |
| 63 | 1 | validate_project | ok | |
| 64 | 2 | validate_draft | LayoutPage | ok |
| 65 | 2 | edit_manifest | pages/sales_2025_page.yaml | ok |
| 66 | 2 | remove_manifest_fields | pages/sales_2025_page.yaml | ok |
| 67 | 2 | build | sales_2025_report | ok |
| 68 | 2 | get_layout_state | sales_2025_report | ok |
| 69 | 2 | get_layout_state | sales_2025_report | tool error |
| 70 | 2 | validate_draft | LayoutPage | ok |
| 71 | 2 | edit_manifest | pages/sales_2025_page.yaml | ok |
| 72 | 2 | build | sales_2025_report | ok |
| 73 | 2 | get_layout_state | sales_2025_report | ok |
| 74 | 2 | validate_project | ok | |
| 75 | 3 | outline_kind | ComponentStyle | ok |
| 76 | 3 | describe_kind | ComponentStyle | ok |
| 77 | 3 | validate_draft | ComponentStyle | ok |
| 78 | 3 | validate_draft | DataSet | ok |
| 79 | 3 | edit_manifest | datasets/sales_2025.yaml | ok |
| 80 | 3 | get_rows | sales_2025_monthly | ok |
| 81 | 3 | edit_manifest | datasets/sales_2025.yaml | ok |
| 82 | 3 | validate_project | ok | |
| 83 | 3 | get_rows | sales_2025_monthly | ok |
| 84 | 3 | validate_draft | LayoutPage | ok |
| 85 | 3 | edit_manifest | pages/sales_2025_page.yaml | ok |
| 86 | 3 | remove_manifest_fields | pages/sales_2025_page.yaml | ok |
| 87 | 3 | build | sales_2025_report | ok |
| 88 | 3 | get_layout_state | sales_2025_report | ok |
| 89 | 3 | validate_draft | LayoutPage | ok |
| 90 | 3 | edit_manifest | pages/sales_2025_page.yaml | ok |
| 91 | 3 | build | sales_2025_report | ok |
| 92 | 3 | get_layout_state | sales_2025_report | ok |
| 93 | 3 | validate_project | ok |
What the agent found about bino
- With measureScale: k, the time chart scales the bars but not the variance bars.
- The time chart has no setting for label digits, so values still show one decimal. Tables have dataFormatDigitsDecimal.
- get_layout_state for a single component failed with an output schema error.
- get_rows returned old rows right after a query changed, until validate_project ran the queries again.
Run it yourself
All files of the run
The project is plain YAML, SQL and CSV. You need bino 0.100.0 or newer to build it, and Claude Code to rerun the agent. A rerun gives a different transcript, because a model does not answer the same way twice.
cd agent-report
bino lint
bino build          # renders dist/sales_2025_report.pdf

./run.sh            # rerun the agent (turn 1)
./run.sh review 1   # send your review of the PDF (turn 2)