
Evaluate report as code in a browser tab.
The sandbox is the real bino toolchain behind a URL: write the manifests on the left, watch the IBCS report render on the right, upload your own CSV, and export the whole thing as a project that runs on a laptop and in CI. Nothing to install, nothing to procure.
- No install
- No account to start
- Shareable by URL
- Exports a runnable project
Editor and report, side by side
Both halves below are real: the file on the left is a live sandbox, and the page on the right is what its preview actually rendered — the same engine that produces the PDF, with the same IBCS discipline.
apiVersion: bino.bi/v1alpha1
kind: DataSource
metadata:
  name: new_cities
spec:
  type: csv
  path: https://sandbox.bino.bi/api/data/new_cities.csv
  delimiter: ";"
---
apiVersion: bino.bi/v1alpha1
kind: DataSet
metadata:
  name: revenue_by_city
spec:
  query: |-
    SELECT category, categoryIndex, operation,
           SUM(pp1) AS pp1, SUM(ac1) AS ac1
    FROM new_cities
    WHERE date = (SELECT max(date) FROM new_cities)
    GROUP BY category, categoryIndex, operation
    ORDER BY categoryIndex
  dependencies:
    - new_cities
---
apiVersion: bino.bi/v1alpha1
kind: DataSet
metadata:
  name: revenue_trend
spec:
  query: |-
    WITH monthly AS (
      SELECT CAST(date_trunc('month', CAST(date AS DATE)) AS DATE) AS month,
             SUM(pp1) AS pp1, SUM(ac1) AS ac1, SUM(fc1) AS fc1
      FROM new_cities
      WHERE date >= '2026-01-01'
      GROUP BY month
    )
    SELECT strftime(month, '%Y-%m-%d') AS date,
           'Total' AS category, 1 AS categoryIndex, '+' AS operation,
           pp1,
           CASE WHEN month <  DATE '2026-07-01' THEN ac1 END AS ac1,
           CASE WHEN month >= DATE '2026-07-01' THEN fc1 END AS fc1
    FROM monthly
    ORDER BY month
  dependencies:
    - new_cities
---
apiVersion: bino.bi/v1alpha1
kind: LayoutPage
metadata:
  name: dashboard
spec:
  pageLayout: 2x2
  titleBusinessUnit: Acme Corp
  titleMeasures:
    - name: Revenue
      unit: EUR k
  titleScenarios: AC, PY, FC
  titleDateEnd: "2026-06-30"
  titleDateFormat: month
  titleDateLink: interval
  footerText: Acme Corp - Monthly Sales Report
  children:
    - kind: ChartStructure
      metadata:
        name: region_chart
      spec:
        dataset: revenue_by_city
        scenarios:
          - ac1
          - pp1
        variances:
          - dac1_pp1_pos
        level: category
        order: ac1
        orderDirection: desc
        percentageScaling: 25
        chartTitle: Revenue by City
    - kind: ChartTime
      metadata:
        name: trend_chart
      spec:
        dataset: revenue_trend
        scenarios:
          - ac1
          - pp1
          - fc1
        level: category
        order: category
        orderDirection: asc
        dateInterval: month
        chartTitle: Monthly Revenue Trend
    - kind: Table
      metadata:
        name: region_table
      spec:
        dataset: revenue_by_city
        scenarios:
          - ac1
          - pp1
        variances:
          - dac1_pp1_pos
        type: sum
        sumTitle: Revenue by City
    - kind: Text
      metadata:
        name: summary
      spec:
        value: |
          **H1 2026 Summary**

          Total revenue reached **EUR 9.1m** year-to-date, slightly ahead of
          prior year at **+0.6%**. Madrid (**+2.1%**) and Amsterdam (**+1.8%**)
          grew fastest, while Seoul fell **-1.4%** vs PY.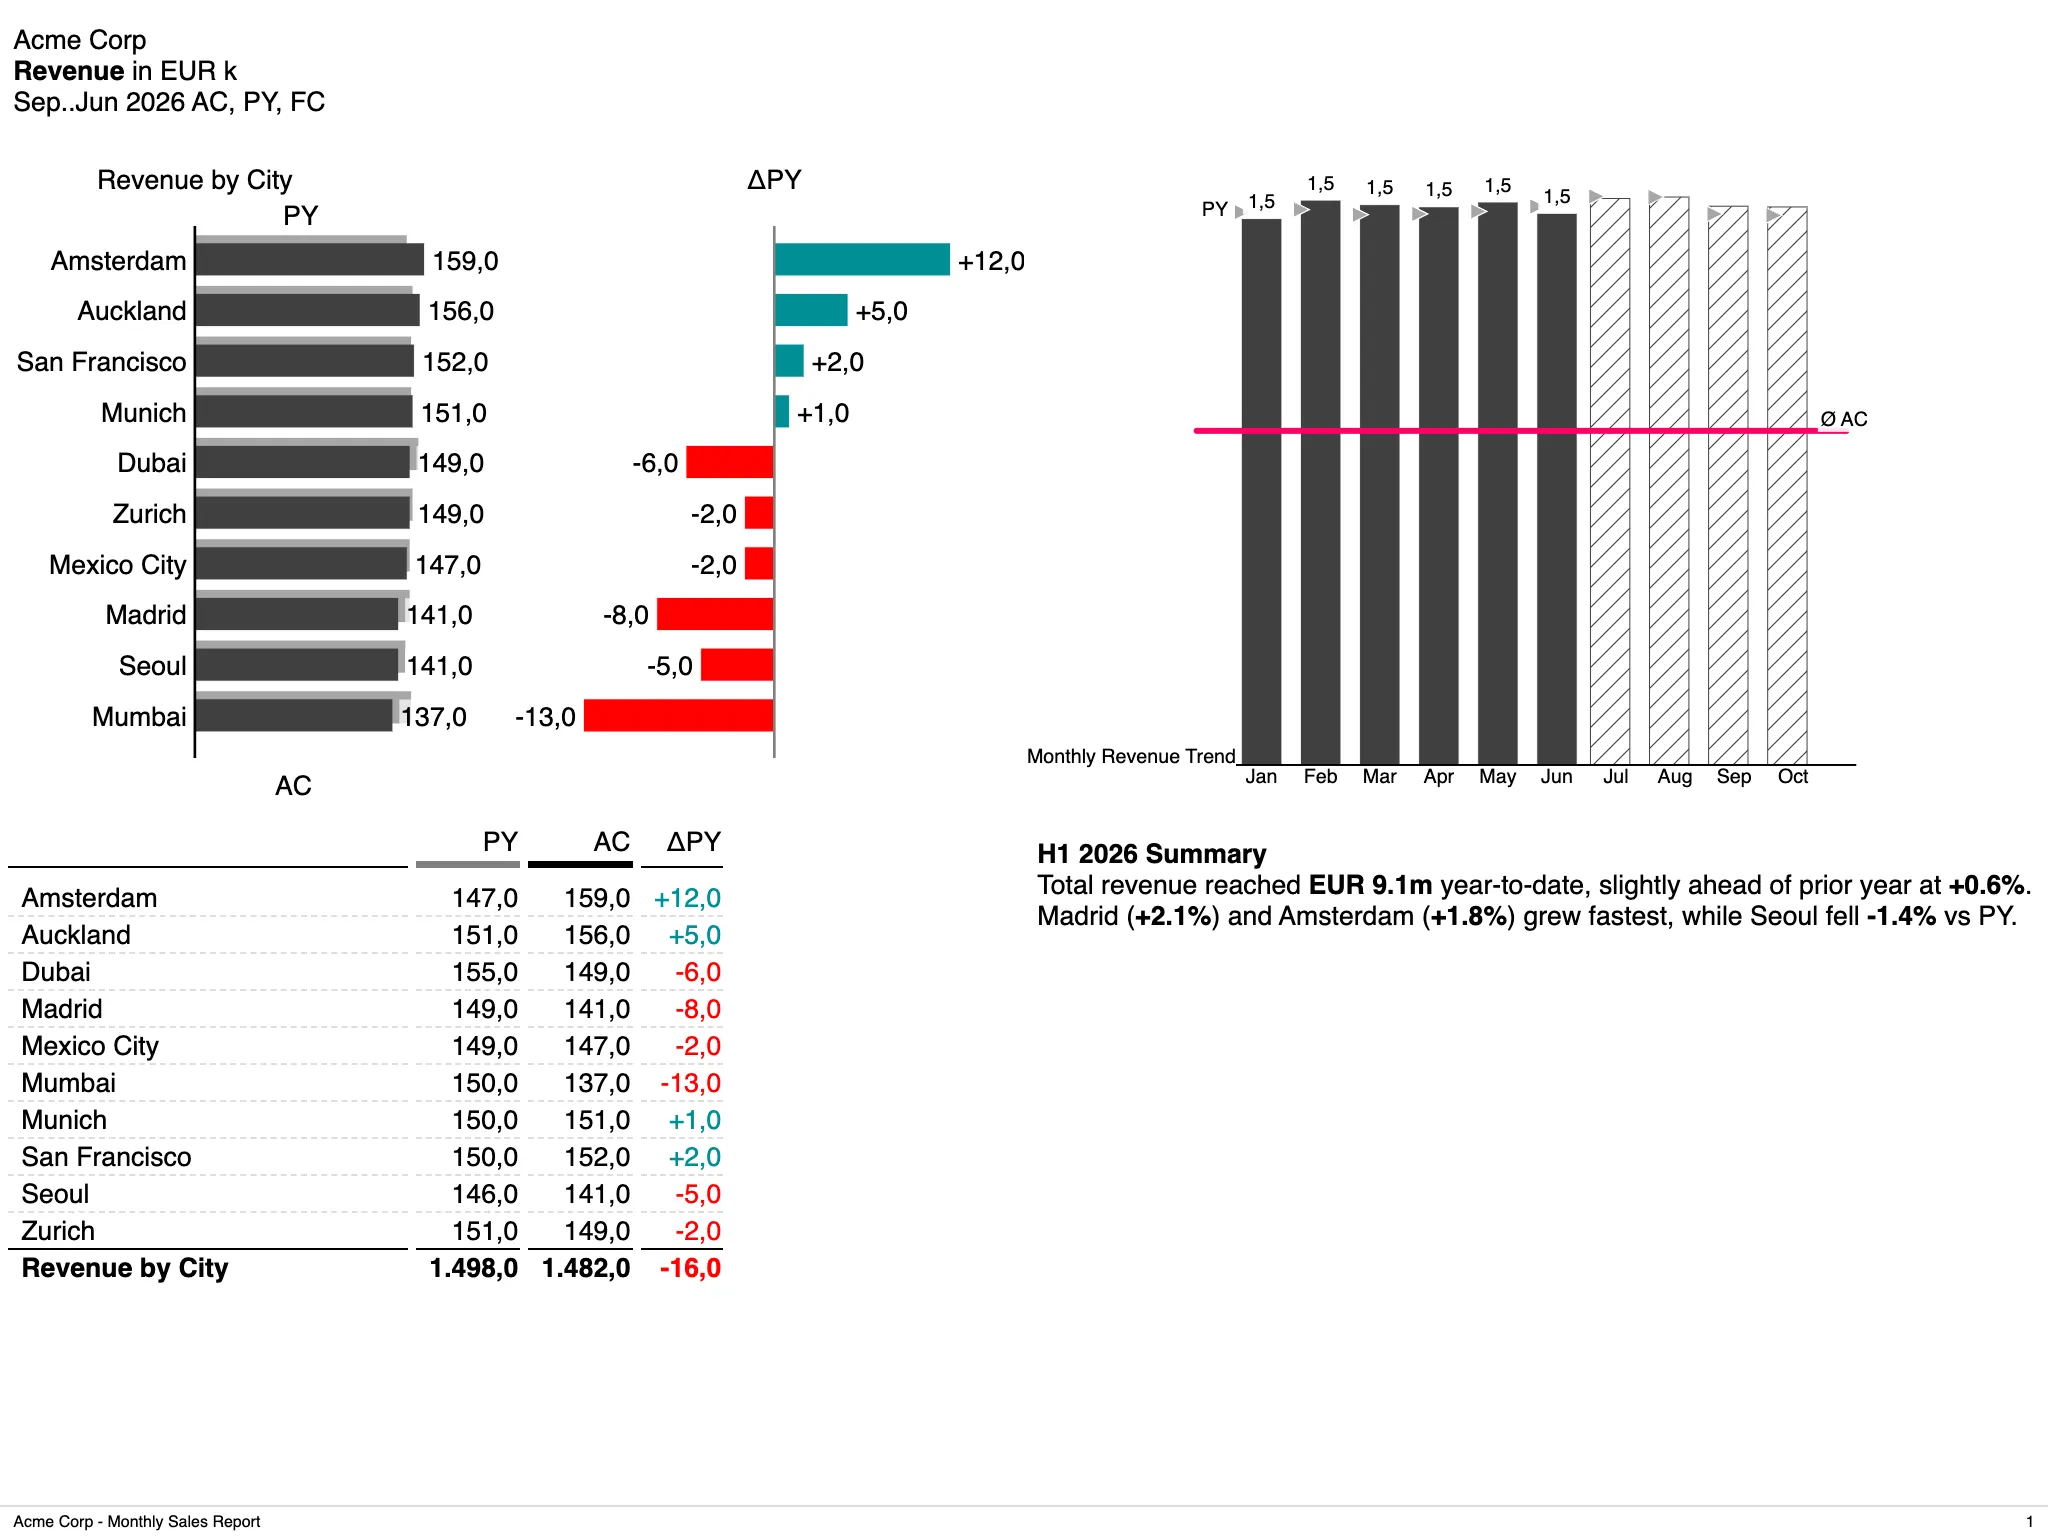
Rendered from this sandbox — the file on the left is the whole of it.Open this sandbox
Why it matters
The shortest distance between "show me" and a decision
Most reporting tools cost a pilot project before anyone can tell whether they fit. The sandbox costs a browser tab, and what comes out of it is the same definition your team would put in the repository.
Evaluate before you commit
A team can test whether report as code fits its monthly close in an afternoon — with its own numbers, and without an install, a licence or a ticket.
Every experiment is a link
A sandbox has a URL. Send it into a review and the room sees both the rendered report and the definition that produced it — no screenshots in slides.
No dead end
Export downloads the sandbox as a runnable bino project. What convinced the room goes straight into the repository; nothing gets rebuilt for production.
Onboarding that scales
New authors start from templates that already render, with autocompletion and live validation from the same language server the IDE uses — not a blank file and a wiki page.
How it works
Write, feed it your data, take it with you
A sandbox is one multi-document YAML file. Everything below is taken verbatim from the sandbox shown above — the same manifests bino builds from, with no sandbox-only dialect to translate afterwards.
One file source and two queries. The first shapes the latest month by city, the second turns the year into a monthly series where actuals hand over to forecast in July:
apiVersion: bino.bi/v1alpha1
kind: DataSource
metadata:
  name: new_cities
spec:
  type: csv
  path: https://sandbox.bino.bi/api/data/new_cities.csv
  delimiter: ";"
---
apiVersion: bino.bi/v1alpha1
kind: DataSet
metadata:
  name: revenue_by_city
spec:
  query: |-
    SELECT category, categoryIndex, operation,
           SUM(pp1) AS pp1, SUM(ac1) AS ac1
    FROM new_cities
    WHERE date = (SELECT max(date) FROM new_cities)
    GROUP BY category, categoryIndex, operation
    ORDER BY categoryIndex
  dependencies:
    - new_cities
---
apiVersion: bino.bi/v1alpha1
kind: DataSet
metadata:
  name: revenue_trend
spec:
  query: |-
    WITH monthly AS (
      SELECT CAST(date_trunc('month', CAST(date AS DATE)) AS DATE) AS month,
             SUM(pp1) AS pp1, SUM(ac1) AS ac1, SUM(fc1) AS fc1
      FROM new_cities
      WHERE date >= '2026-01-01'
      GROUP BY month
    )
    SELECT strftime(month, '%Y-%m-%d') AS date,
           'Total' AS category, 1 AS categoryIndex, '+' AS operation,
           pp1,
           CASE WHEN month <  DATE '2026-07-01' THEN ac1 END AS ac1,
           CASE WHEN month >= DATE '2026-07-01' THEN fc1 END AS fc1
    FROM monthly
    ORDER BY month
  dependencies:
    - new_cities
The editor autocompletes kind values, the spec fields of each kind, enum values, dataset references and even the column names your query returns — and marks schema and lint problems as you type.
The page composes those datasets into the four panels you can see above: a variance bar chart, a trend chart, a table and the written summary.
apiVersion: bino.bi/v1alpha1
kind: LayoutPage
metadata:
  name: dashboard
spec:
  pageLayout: 2x2
  titleBusinessUnit: Acme Corp
  titleMeasures:
    - name: Revenue
      unit: EUR k
  titleScenarios: AC, PY, FC
  titleDateEnd: "2026-06-30"
  titleDateFormat: month
  titleDateLink: interval
  footerText: Acme Corp - Monthly Sales Report
  children:
    - kind: ChartStructure
      metadata:
        name: region_chart
      spec:
        dataset: revenue_by_city
        scenarios:
          - ac1
          - pp1
        variances:
          - dac1_pp1_pos
        level: category
        order: ac1
        orderDirection: desc
        percentageScaling: 25
        chartTitle: Revenue by City
    - kind: ChartTime
      metadata:
        name: trend_chart
      spec:
        dataset: revenue_trend
        scenarios:
          - ac1
          - pp1
          - fc1
        level: category
        order: category
        orderDirection: asc
        dateInterval: month
        chartTitle: Monthly Revenue Trend
    - kind: Table
      metadata:
        name: region_table
      spec:
        dataset: revenue_by_city
        scenarios:
          - ac1
          - pp1
        variances:
          - dac1_pp1_pos
        type: sum
        sumTitle: Revenue by City
    - kind: Text
      metadata:
        name: summary
      spec:
        value: |
          **H1 2026 Summary**

          Total revenue reached **EUR 9.1m** year-to-date, slightly ahead of
          prior year at **+0.6%**. Madrid (**+2.1%**) and Amsterdam (**+1.8%**)
          grew fastest, while Seoul fell **-1.4%** vs PY.
Scenarios (ac1, pp1, fc1) and variances (dac1_pp1_pos) are IBCS notation, not styling — the engine decides how each is drawn so every report in the company reads the same way.
Upload a CSV or Excel file and the sandbox appends a matching DataSource and DataSet to the editor, ready to query:
apiVersion: bino.bi/v1alpha1
kind: DataSource
metadata:
  name: sales_q1
spec:
  type: csv
  path: data/sales_q1.csv
---
apiVersion: bino.bi/v1alpha1
kind: DataSet
metadata:
  name: sales_q1_ds
spec:
  query: SELECT * FROM sales_q1
  dependencies:
    - sales_q1
From there it is plain SQL in bino’s embedded engine. The interactive DataSet builder can assemble the query for you if you would rather click than type.
Export downloads the sandbox as a runnable bino project. Unzip it and the same definition renders locally and in your pipeline:
unzip sales-dashboard.zip
cd sales-dashboard

# the same live preview, on your machine
bino preview

# and the PDF
bino build
A ReportArtefact also renders to PDF straight from the sandbox, and any sandbox can be embedded elsewhere as a frozen public snapshot.
What you can render
From a single chart to the finished PDF
Preview a standalone component while you shape it, then wrap it in a layout page and a report artefact — all in the same file.
Start from a template
Blank sandbox
The minimal starter: the hosted sample CSV, a DataSet and a Table.
Structure chart
Revenue by city as an IBCS bar chart with actual vs. prior-year variances.
Time series
Monthly revenue trend mixing actuals with a forecast for the rest of the year.
Dashboard page
A 2×2 layout combining a structure chart, trend chart, table and commentary.
Full report (PDF)
The dashboard page wrapped in a ReportArtefact, ready for the PDF download.
Sharing & privacy
Share the link, keep the pen.
Edit rights are a capability held by your browser, not something the URL carries. That makes a sandbox safe to send around: a link is an invitation to look, not to overwrite.
Sharing a link
- The share URL never carries the edit token — recipients get a read-only view.
- Anyone can fork a sandbox into their own copy and edit that instead. The original is untouched.
- Snapshots let you save a state you can restore or fork later.
- Embed snippets are public, frozen snapshots — they do not follow later edits.
Keeping it to yourself
- A sandbox appears in the public Explore feed only when you explicitly list it there.
- With an account, a sandbox can be marked private — visible to you alone.
- Accounts are optional and passwordless: a code by email, no password to manage.
- A private sandbox is shared through a short-lived read link, not a permanent public URL.
Deployment
Our infrastructure, or yours
The public sandbox is free and stays free. Organisations that want their teams experimenting on internal numbers choose where the sandbox runs — we operate it, or you run it inside your own network.
Public sandbox
sandbox.bino.bi — open a tab and start writing.
- Unlimited sandboxes, no account to start
- Templates and a public Explore feed
- CSV and Excel upload
- PDF export and runnable-project download
Sandbox as a Service
A dedicated sandbox for your organisation, run by us.
- Your teams experiment on internal data in your own instance
- Accounts and private sandboxes
- Your private registry packages available in the editor
- Hosting in the EU
- Onboarding, IBCS coaching and support with guaranteed response times
Self-hosted / on-prem
One binary plus a container runtime, in your own data centre or VPC.
- A single Go binary with the web app embedded
- Every render runs in its own container with CPU, memory and process ceilings
- You decide which bino versions your teams may select
- Confidential figures never leave your network
- Container image and deployment support
Technical detail
What your architects will ask before you send the link around
How the sandbox renders, what it isolates, and where the limits are.
The editor
- Autocompletion for
kindvalues, thespecfields of each kind, enum values, dataset and datasource references, and dataset column names. - Live schema and lint diagnostics, shown as squiggles while you type.
- Both are driven by bino’s own language server — the same intelligence as the VS Code extension.
- Engine errors surface in a console pane instead of a blank preview.
- Switch the report language to see the rendered output in another locale.
Rendering
- Each active sandbox runs its own
bino preview; the app proxies its embedding endpoint. - Embeddings render self-contained, so the preview shows exactly what the build would.
- Standalone components and full outputs alike: Table, ChartStructure, ChartTime, Text, Tree, Grid, Image, LayoutPage, DocumentArtefact, ReportArtefact.
- A ReportArtefact builds a real PDF, rendered by the same engine as
bino build.
Data
- Upload a CSV or Excel file; a matching
DataSourceandDataSetare written into the editor for you. - Excel uploads carry the sheet name into the manifest.
- Queries run as plain SQL in bino’s embedded engine.
- An interactive builder can assemble the DataSet SQL step by step and keeps a log of what it did.
- A hosted sample dataset is available to every sandbox, so a blank start still renders something.
Isolation & limits
- Every bino invocation runs as its own container: its own filesystem, process tree, network namespace and cgroup.
- Per-container ceilings — 1 GB memory, 1 CPU, 256 processes; PDF builds get 2 GB.
- Removing a container takes the whole process tree with it, so nothing outlives a session.
- Concurrent previews are capped; over the cap a preview answers 503 rather than degrading everyone.
- Idle sessions are reaped after 10 minutes.
Sharing & persistence
- Sandboxes persist at a stable URL and survive a closed tab.
- Edit access is a bearer token minted on create or fork and kept in your browser — the share URL never contains it.
- Snapshots can be restored or forked later.
- Embed snippets are public, frozen snapshots and do not follow later edits.
Registry & runtime
- Browse the public registry from the editor and add packages as dependencies — backed by real
bino registryruns. - Installed packages behave like local documents, exactly as in a checked-out project.
- Pick which bino version renders a sandbox, from the catalogue the deployment allows.
- The catalogue reports the engine version behind each release, so you can reproduce an older render.
Documentation
From the sandbox to a real project
Everything you write in the sandbox is documented as a normal bino project.
Key ideas
What a manifest is, how documents relate, and why reports are defined as code.
Your first report
The guided path from an empty directory to a rendered PDF.
bino preview
The live preview you get in the sandbox, running on your own machine.
Data from CSV and Excel
Declaring file data sources, sheets, delimiters and typed columns.
The data model
DataSource, DataSet and how scenarios and variances are expressed.
ChartStructure reference
Every field of the chart in the example above, with its defaults.
Where it fits
A sandbox for your organisation?
Tell us which teams should be experimenting and on what data. We will show you the shortest path — hosted by us, or running in your own network.