
Scenarios
In which order should scenarios be displayed?
In the Western hemisphere, the direction of writing, reading, and “time” usually determines the presentation as well: we write and read from left to right. It is therefore recommended to display scenarios accordingly, for example in the report title or in a table.
As a reference point, scenarios should be shown in the order of their creation — both when displaying the full set and when displaying a subset. The arrangement is: previous year (py), plan (pl), forecast (fc), and actual (ac). This order is also the default in the Workbench.
The columns of a table follow the same arrangement.
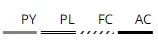
The same applies to a time chart, where the direction of time in the BinoBI Workbench implicitly runs from left to right. Multiple scenarios are visualized overlapping: the more recent one sits at the front right, the older one is placed behind to the left. Additional scenarios are rendered as a triangle for better readability.
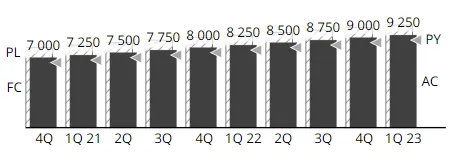
The structure chart follows this scenario display rule analogously.
For some companies or industries, deviating from the recommendation above can make sense. Such a deviation should, however, be applied rigorously and consistently across the company.